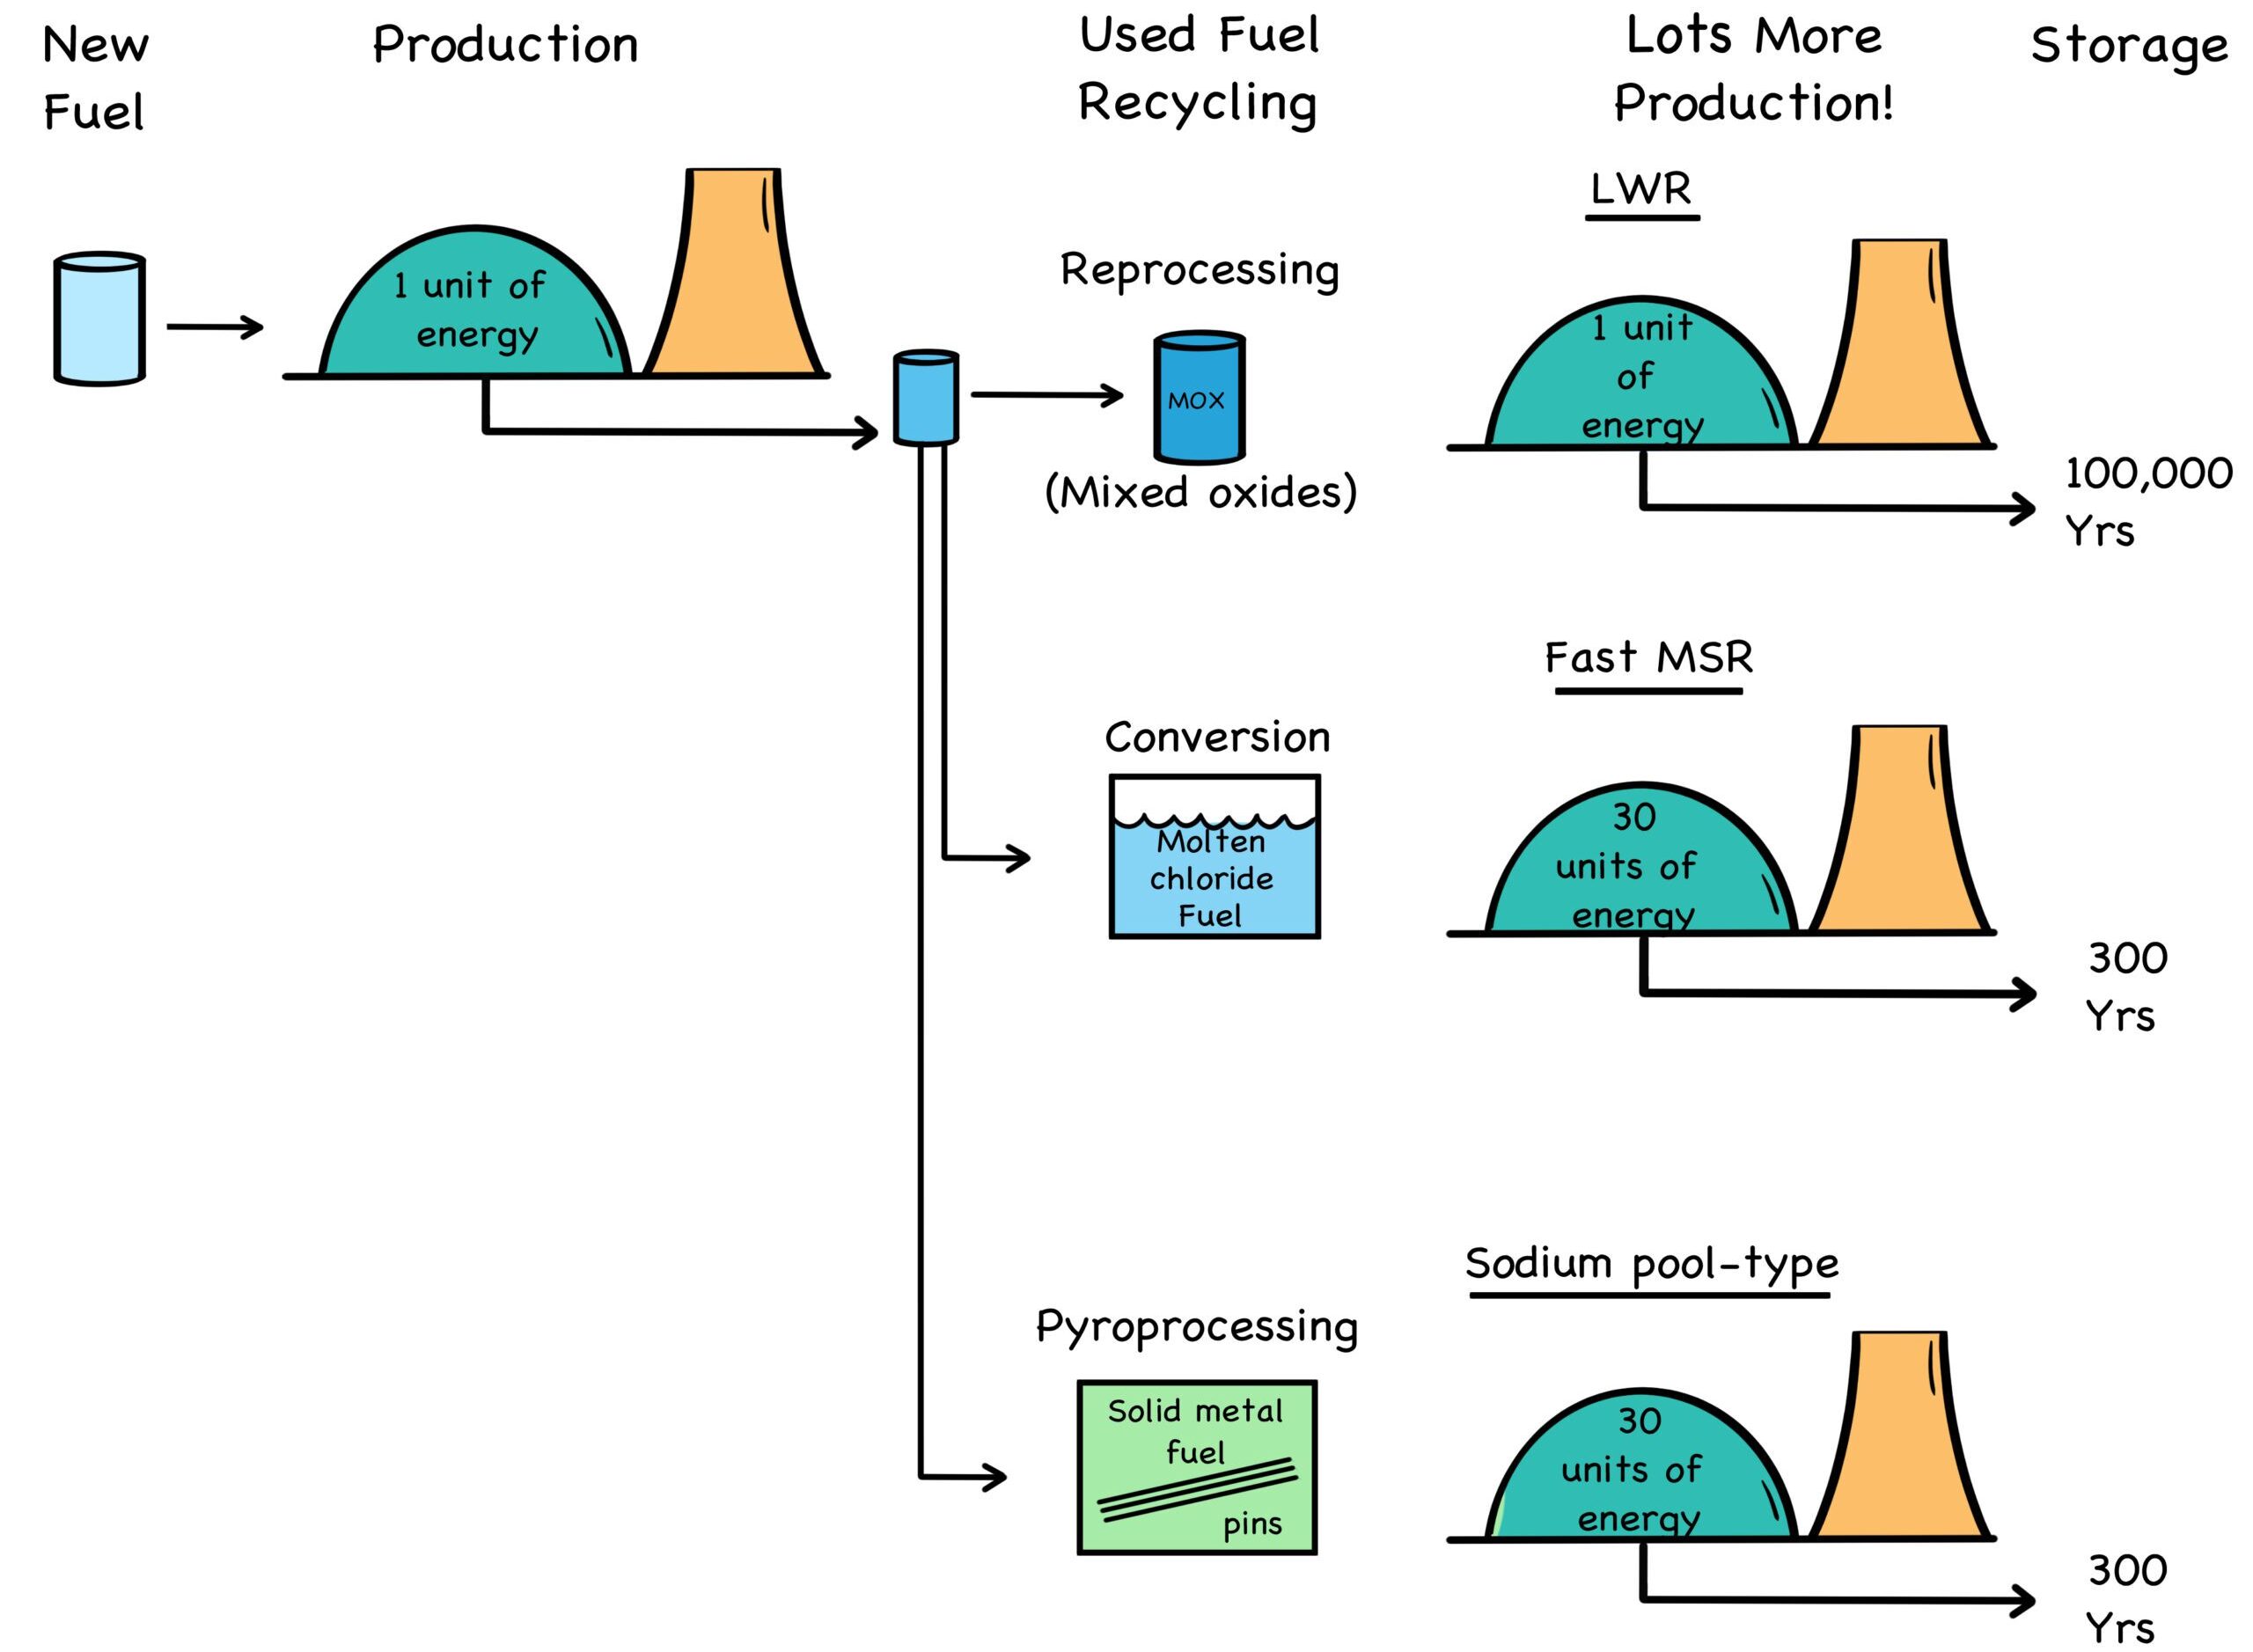
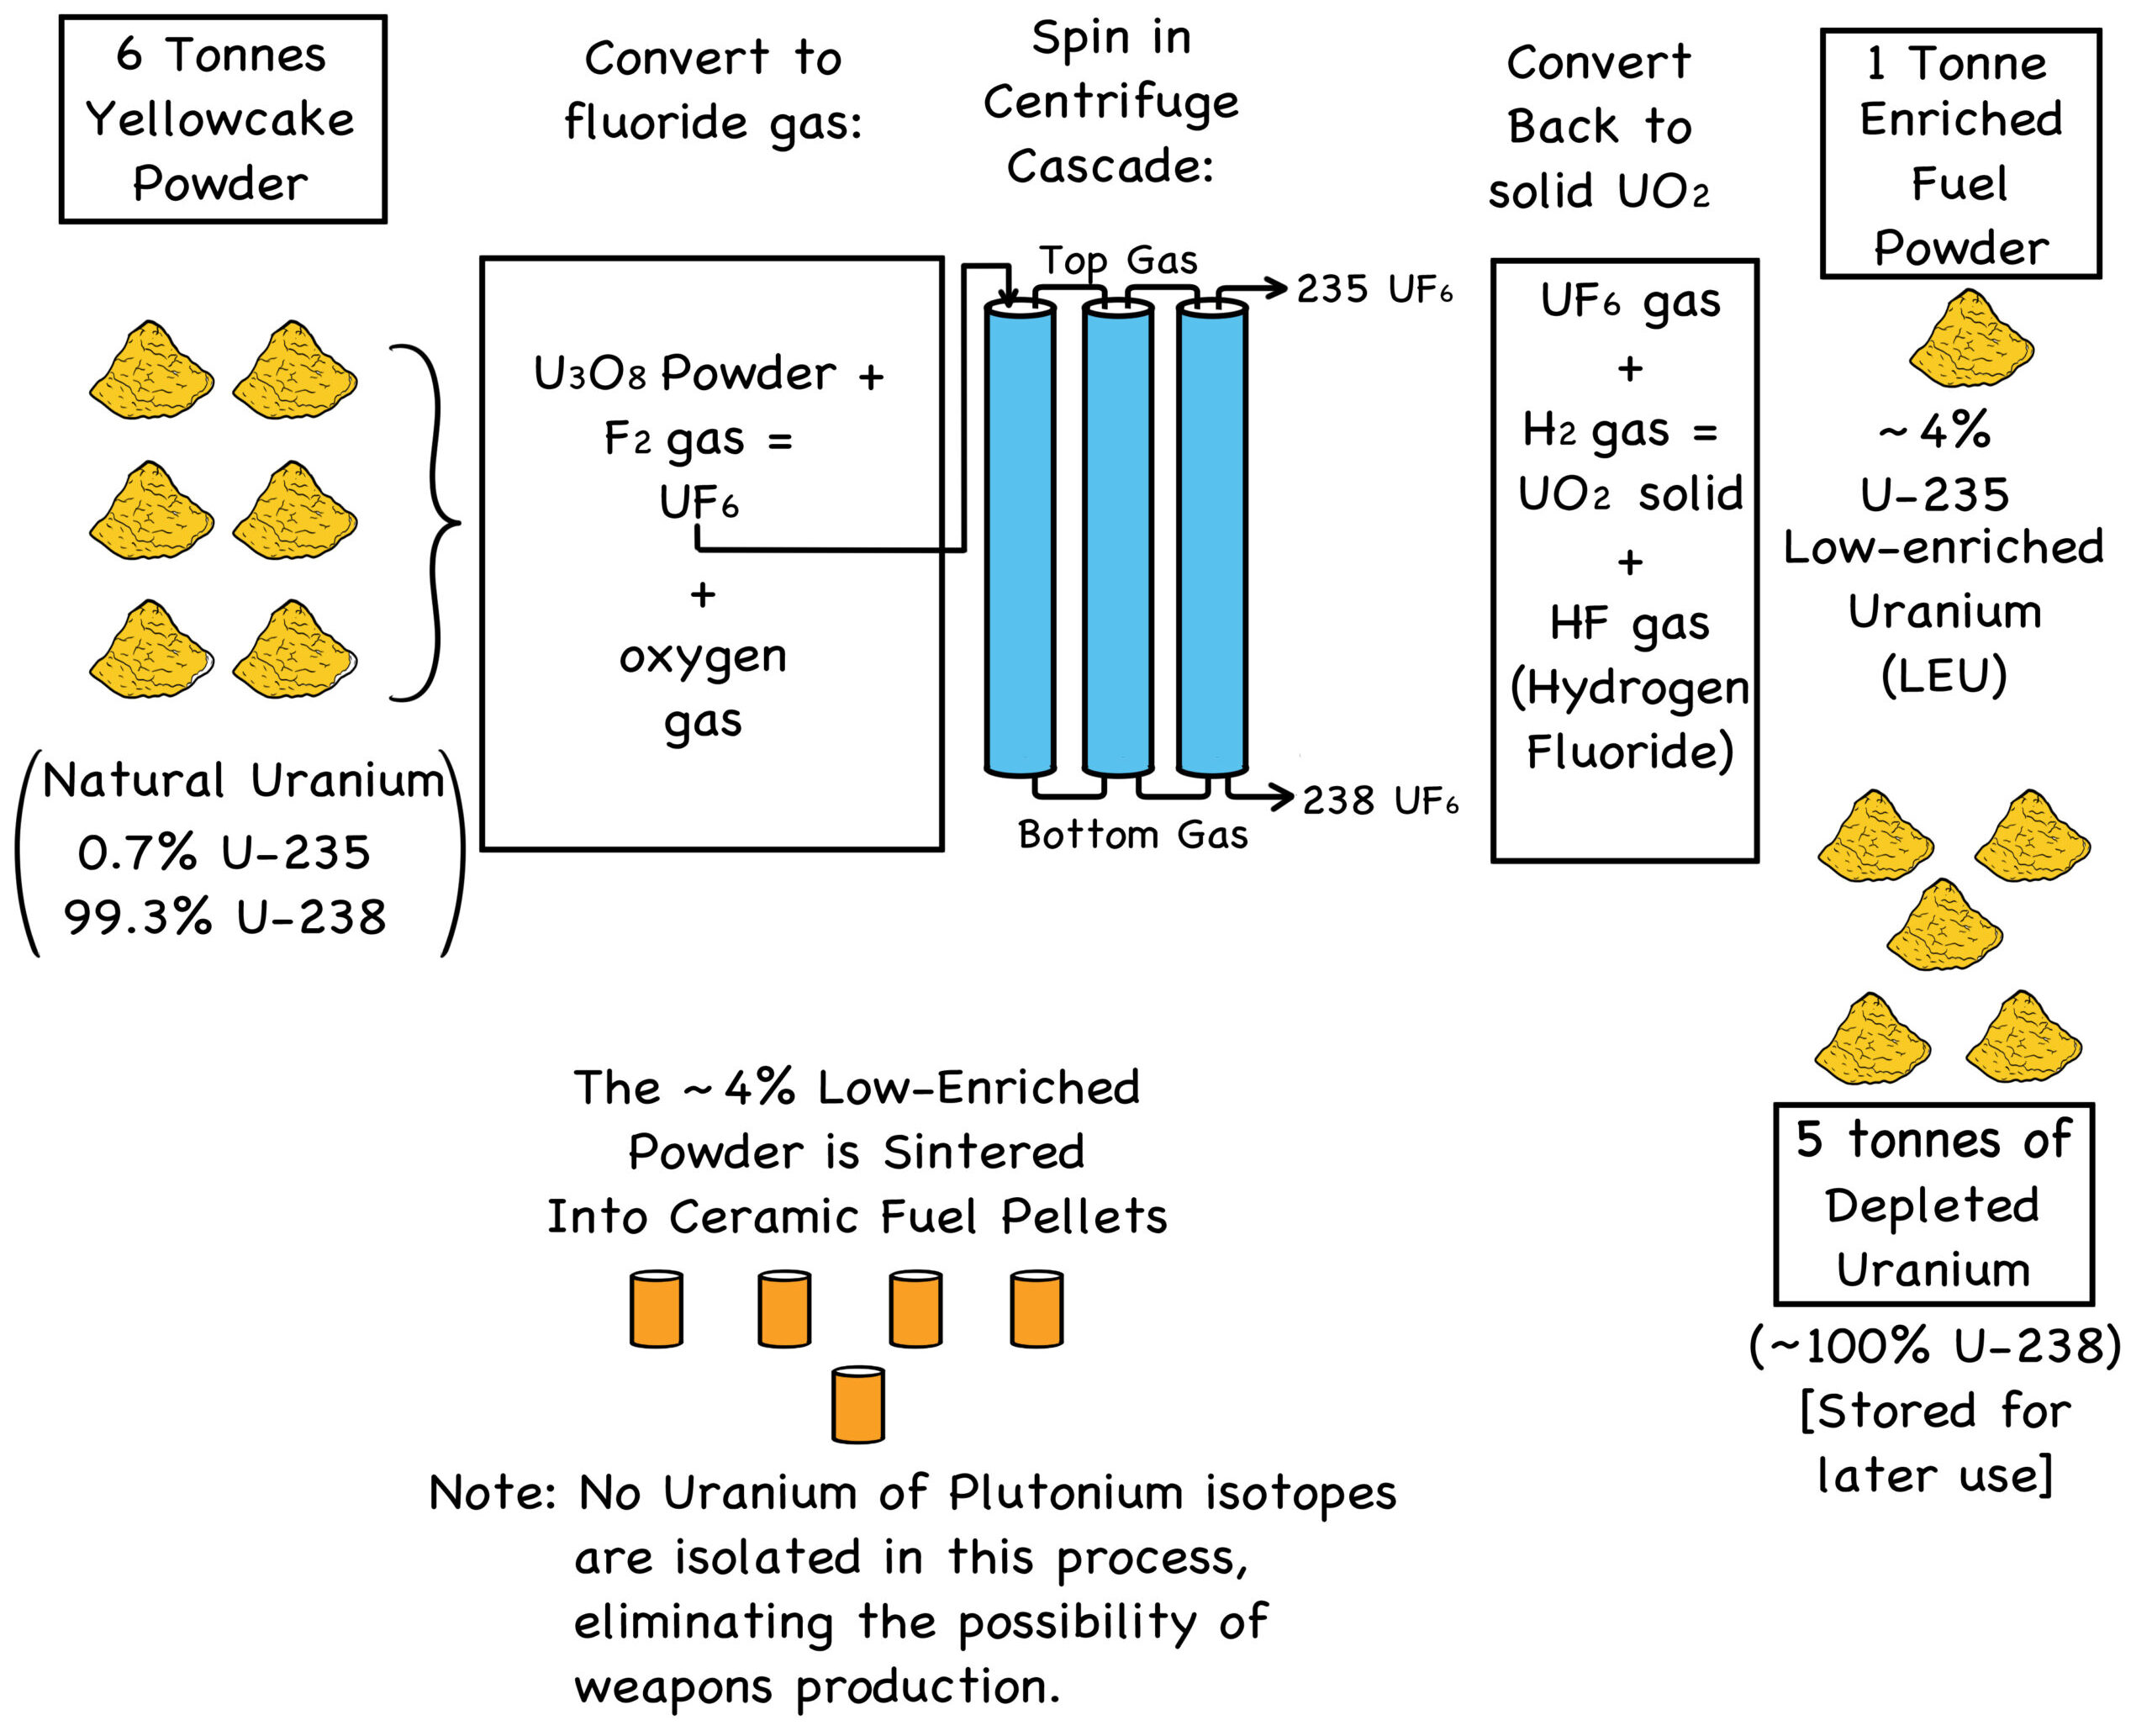
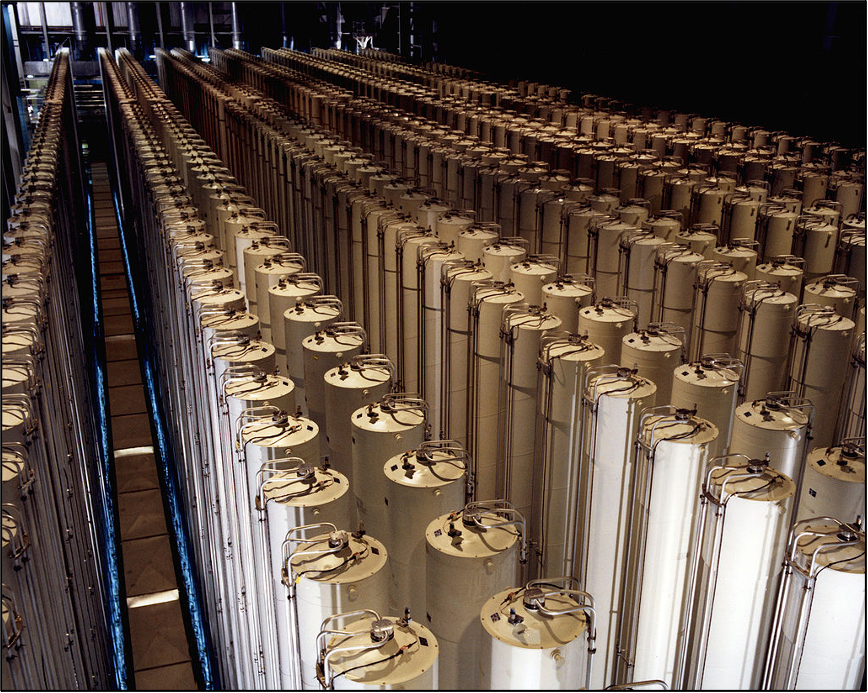
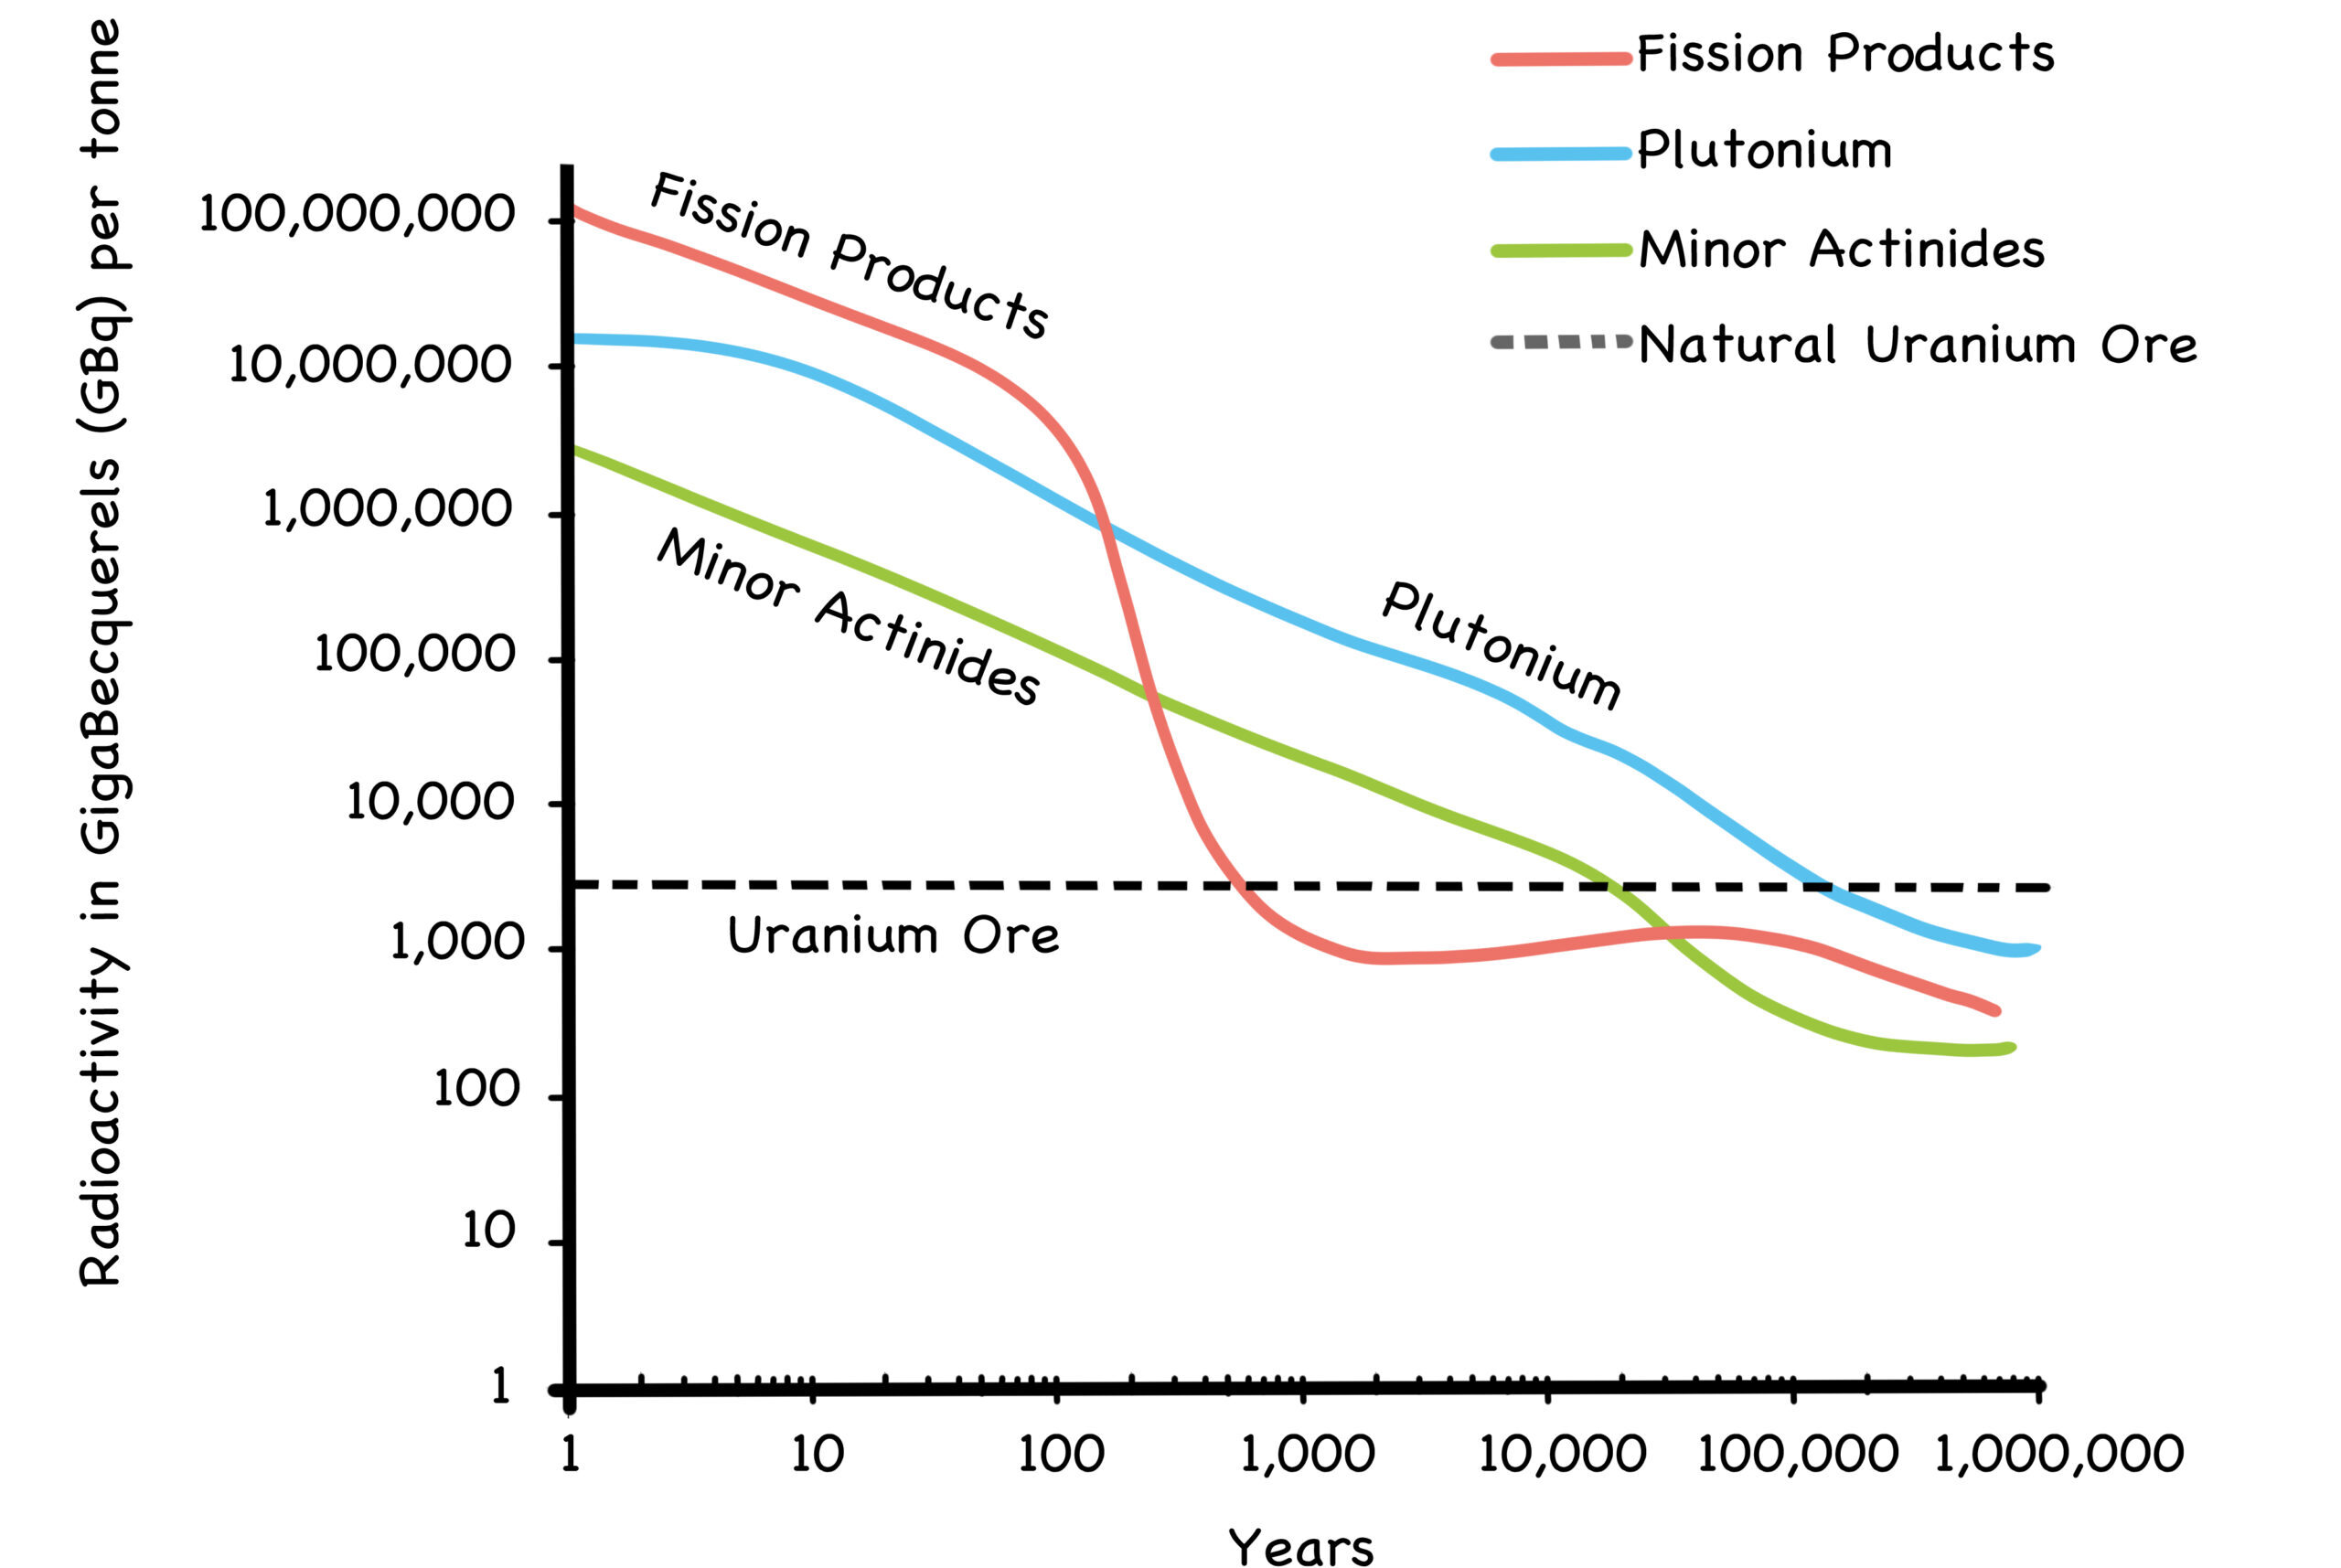
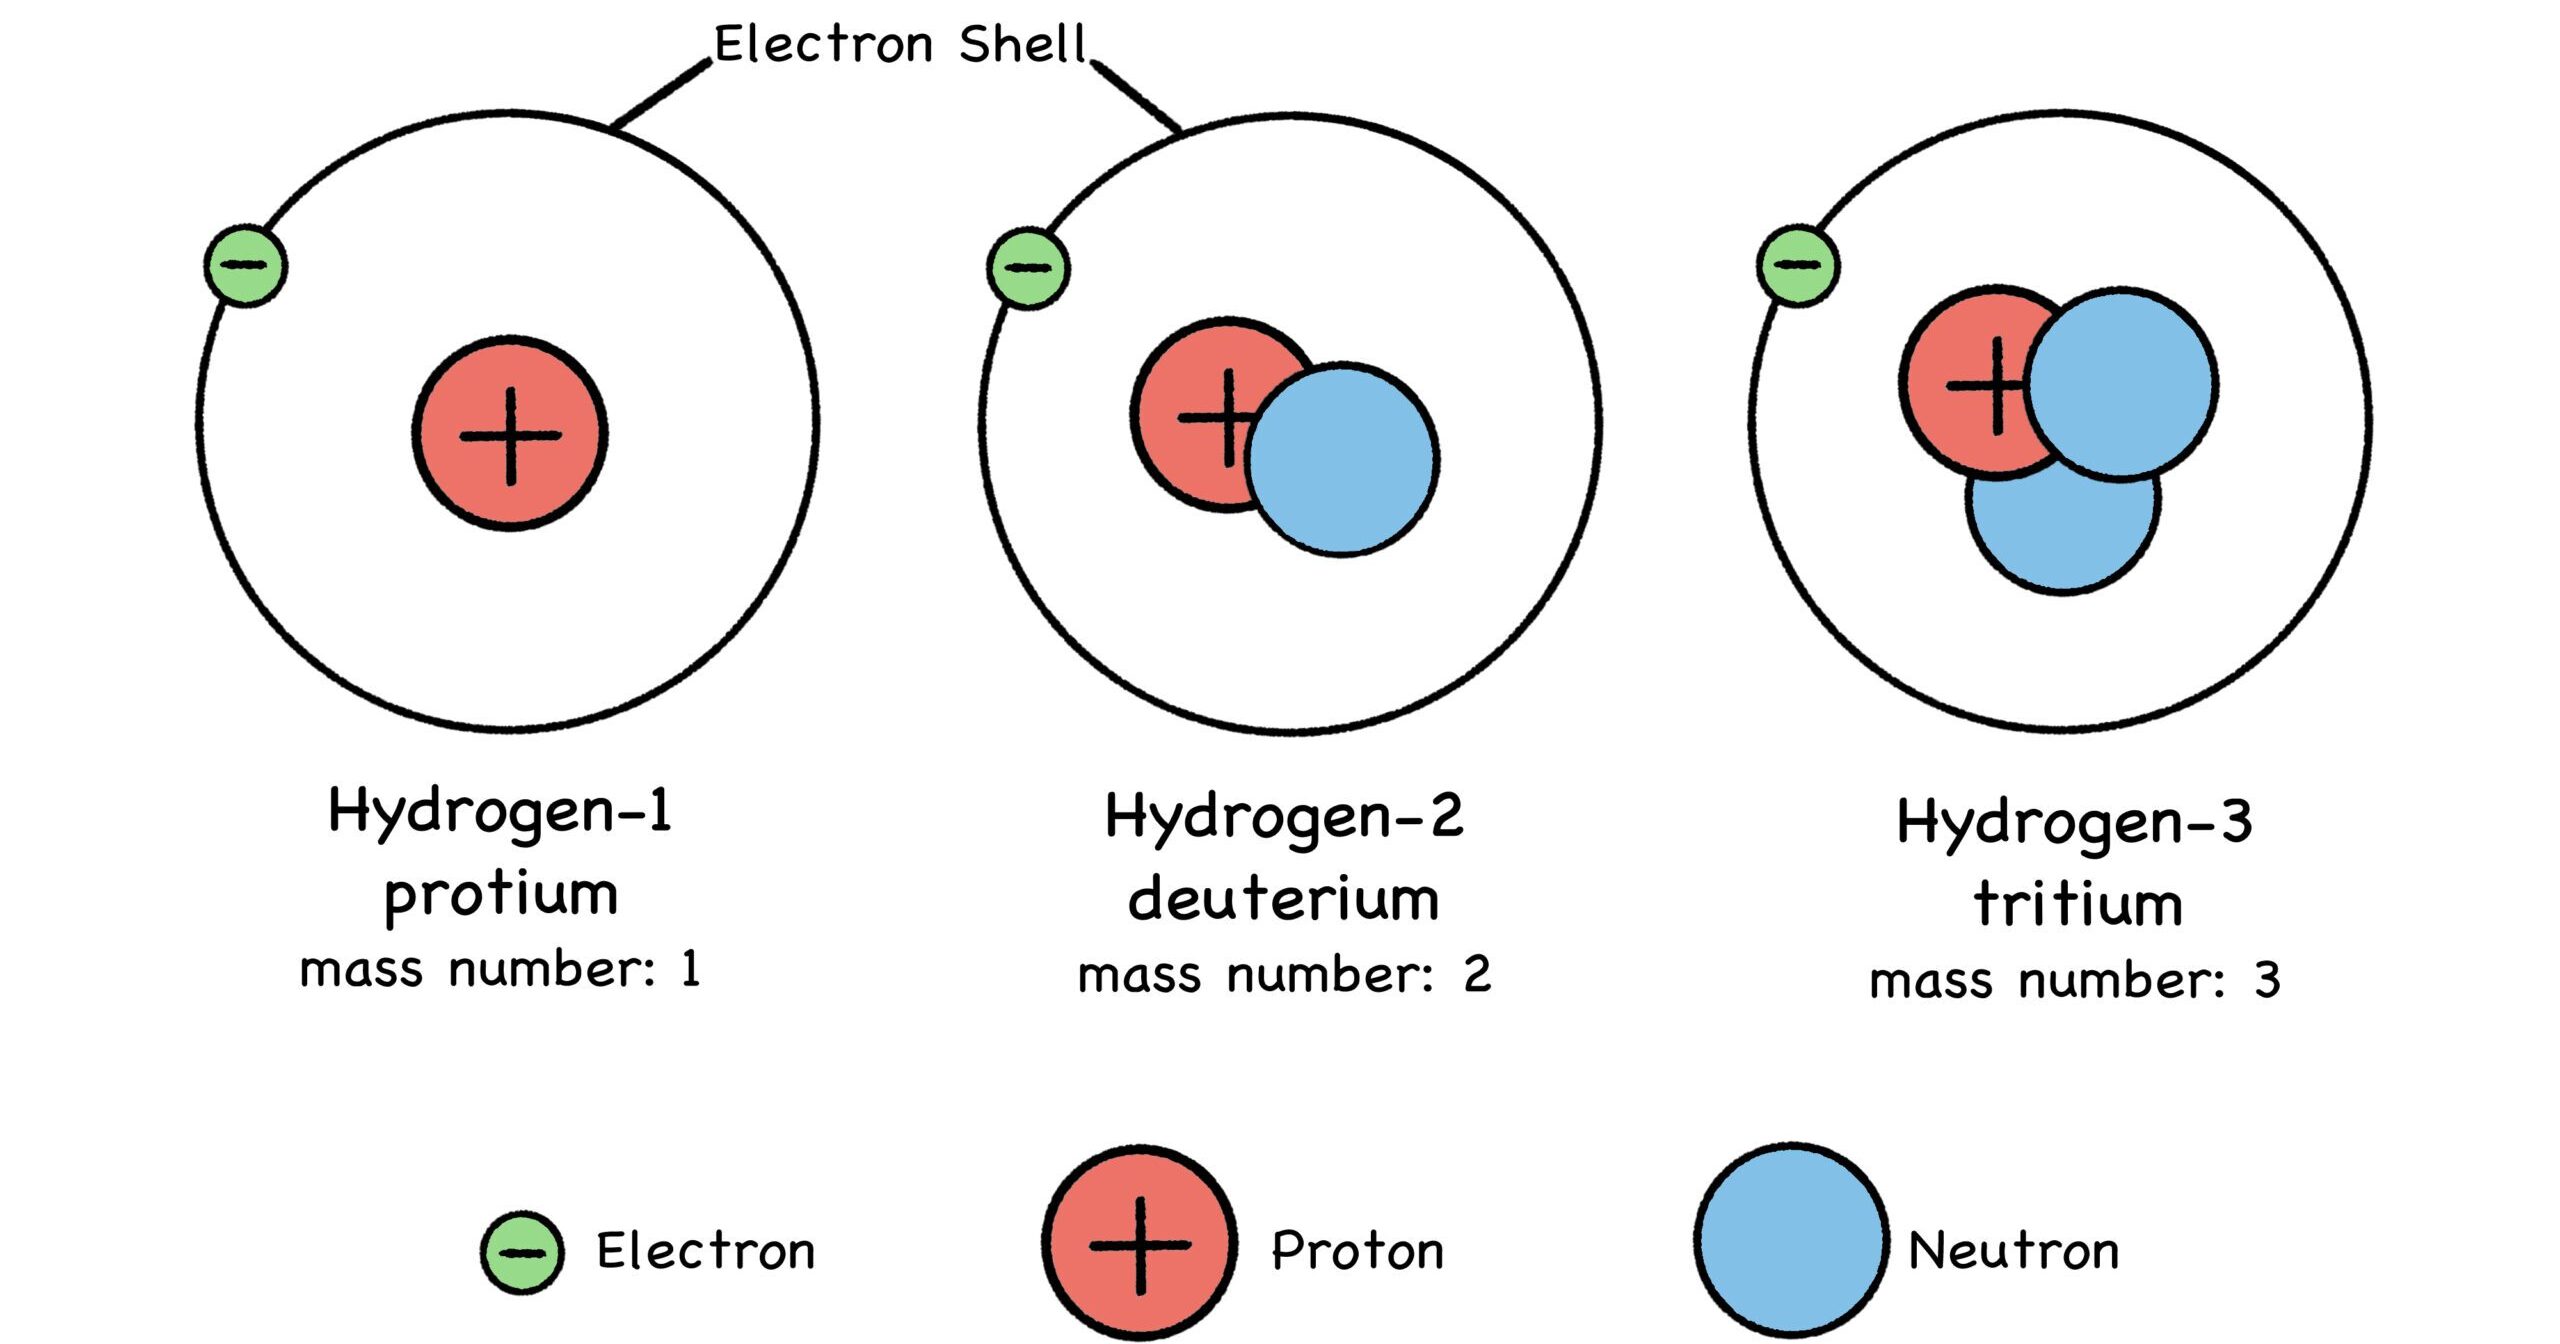
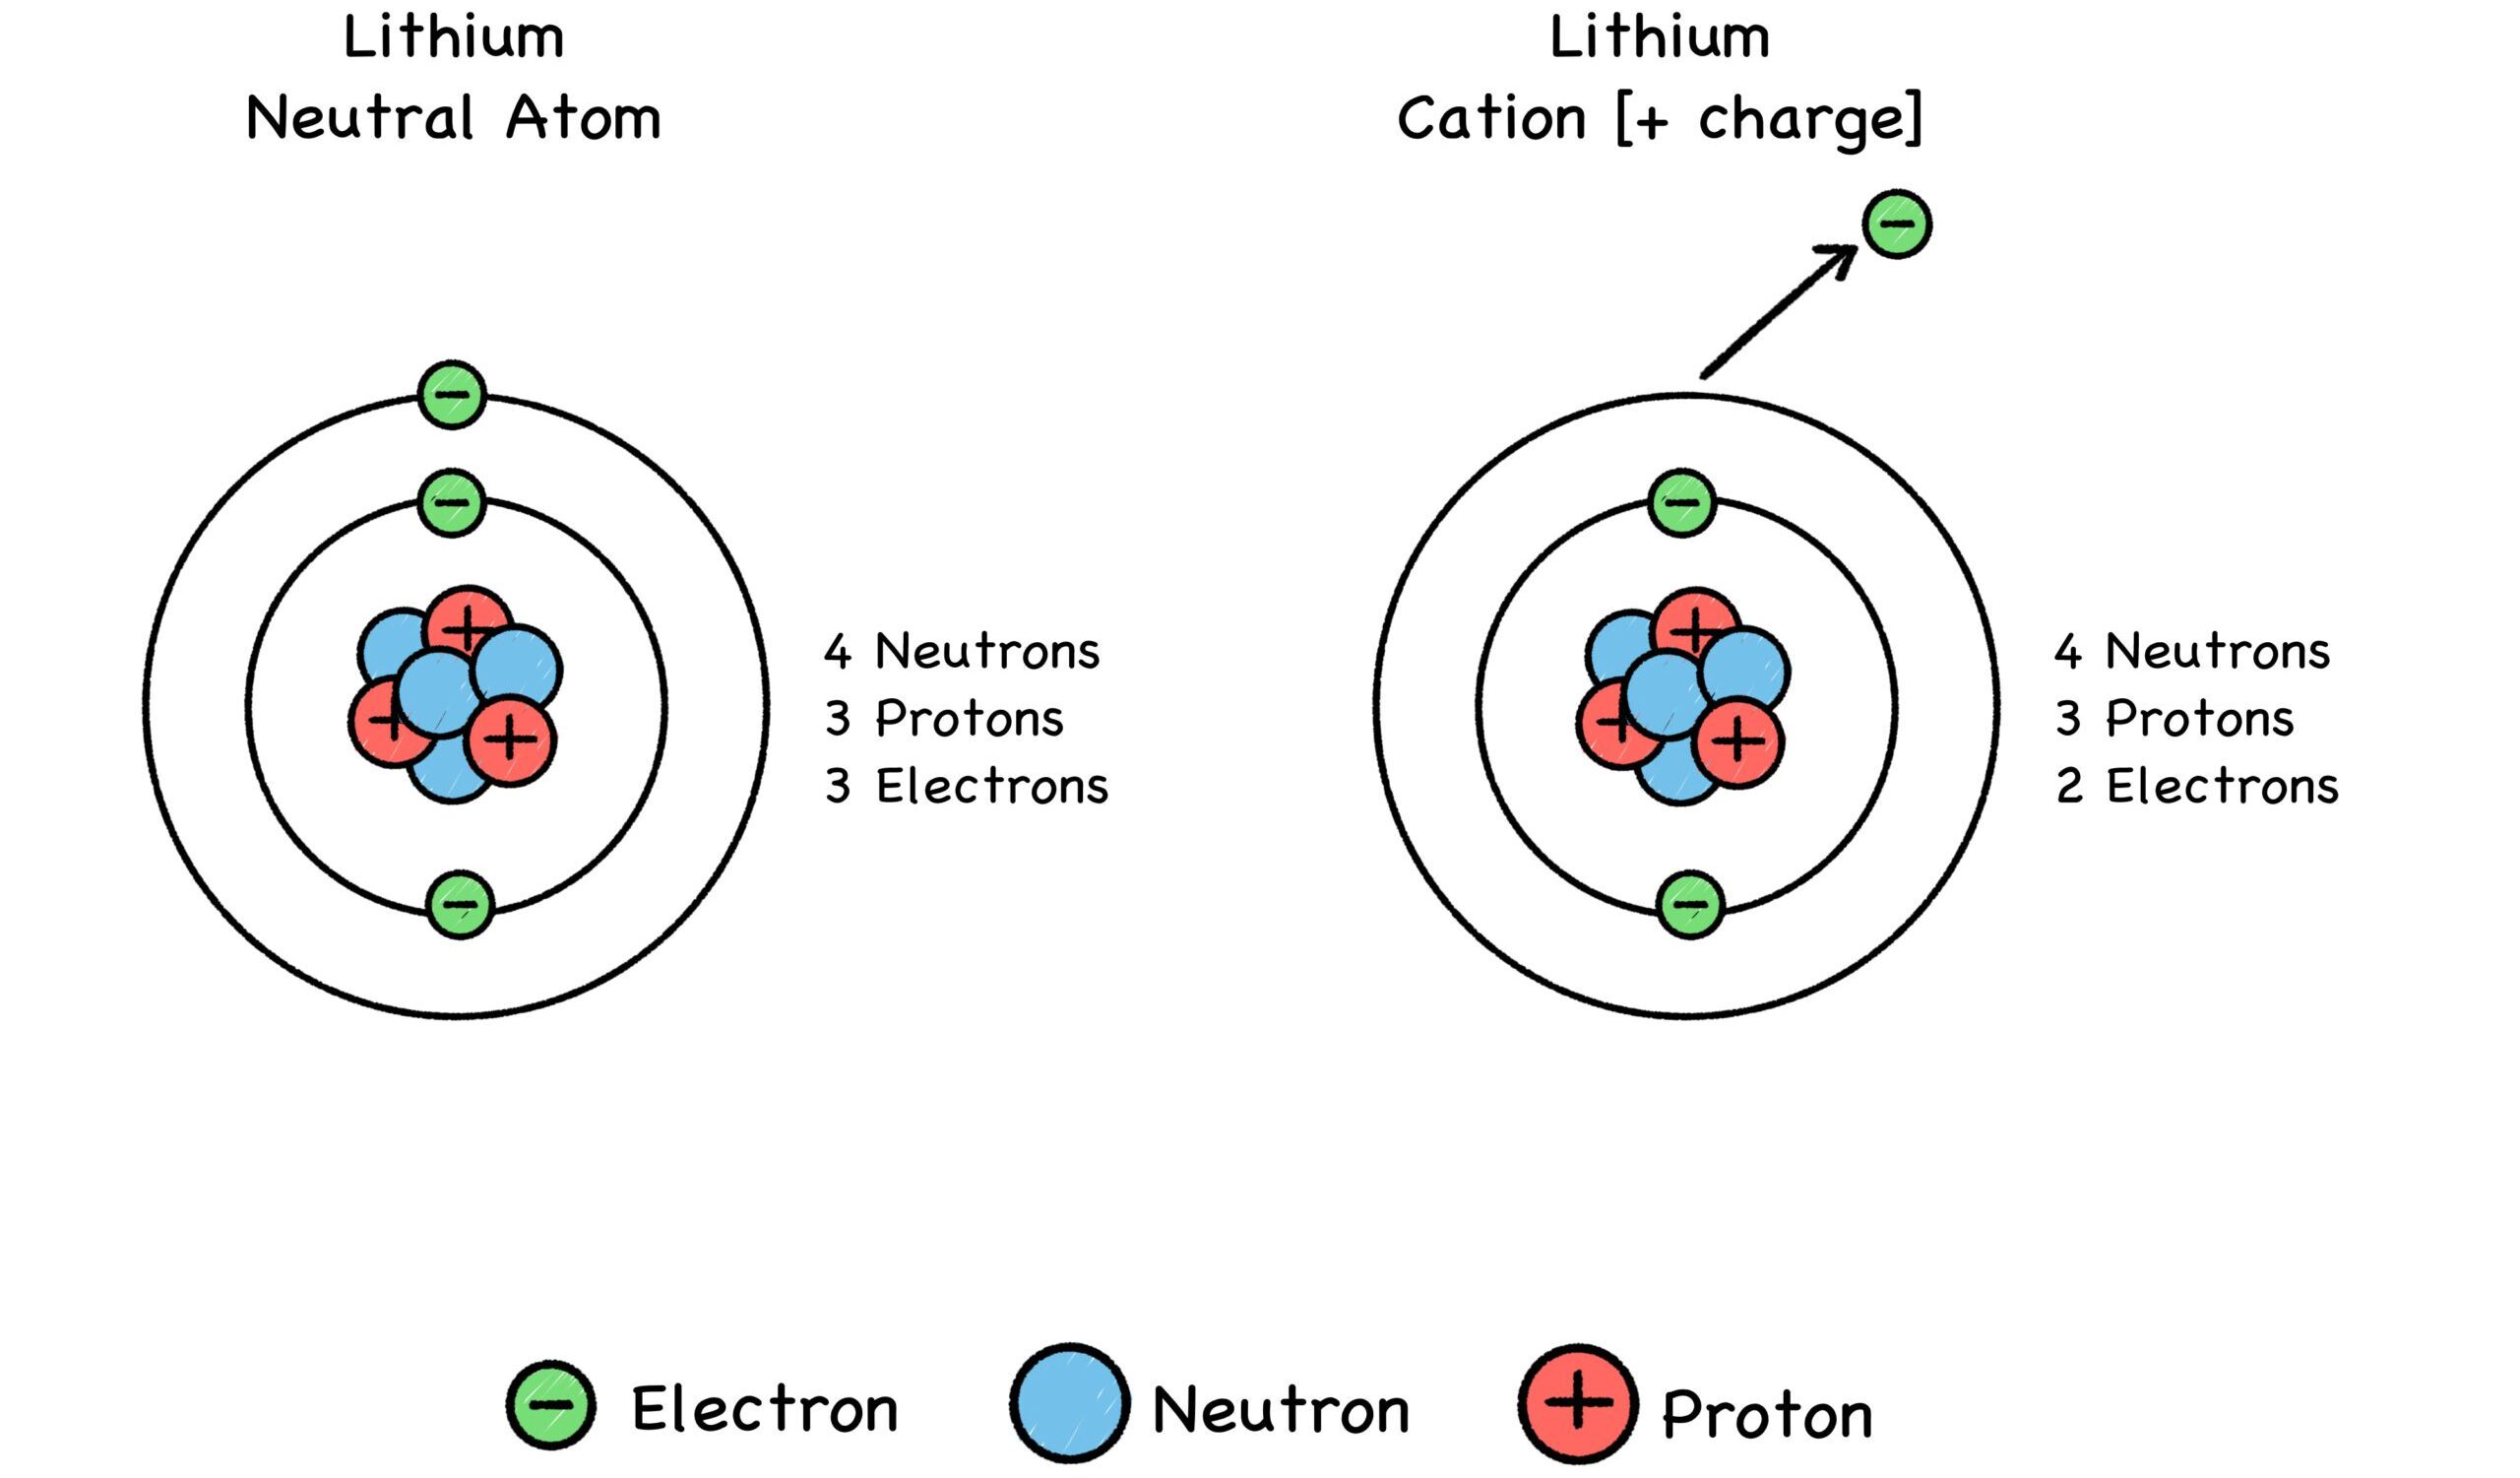
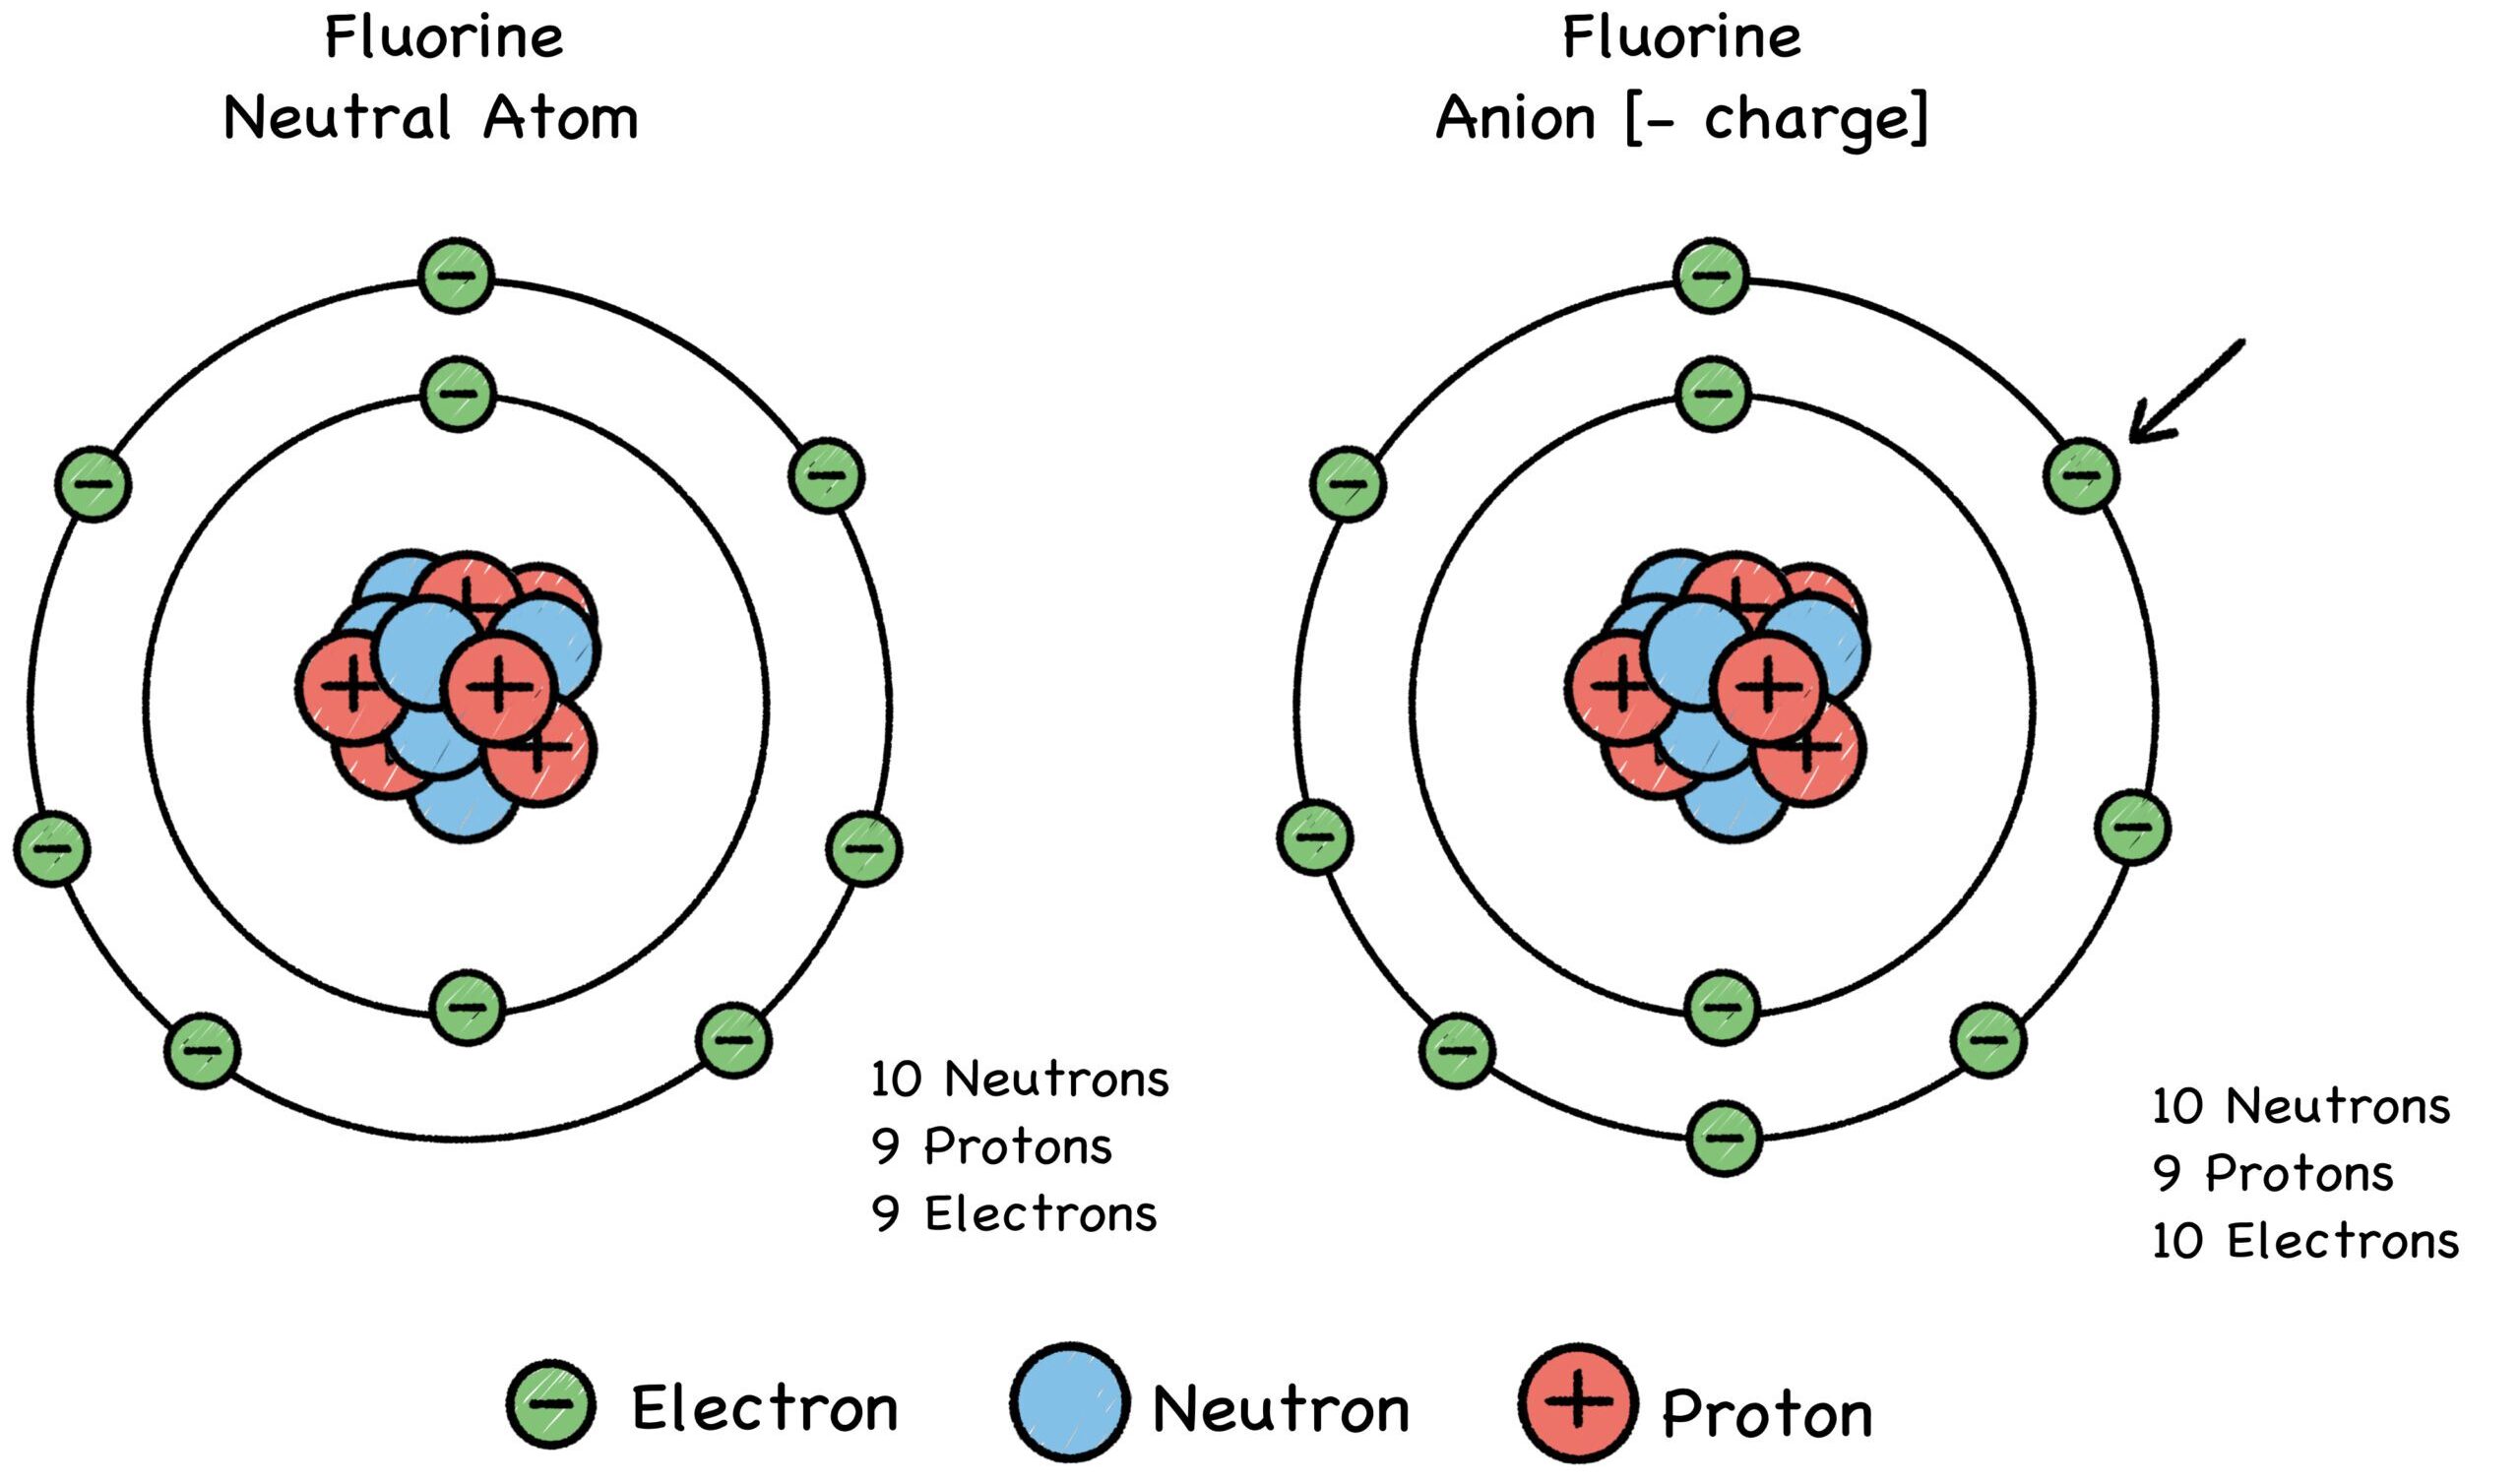
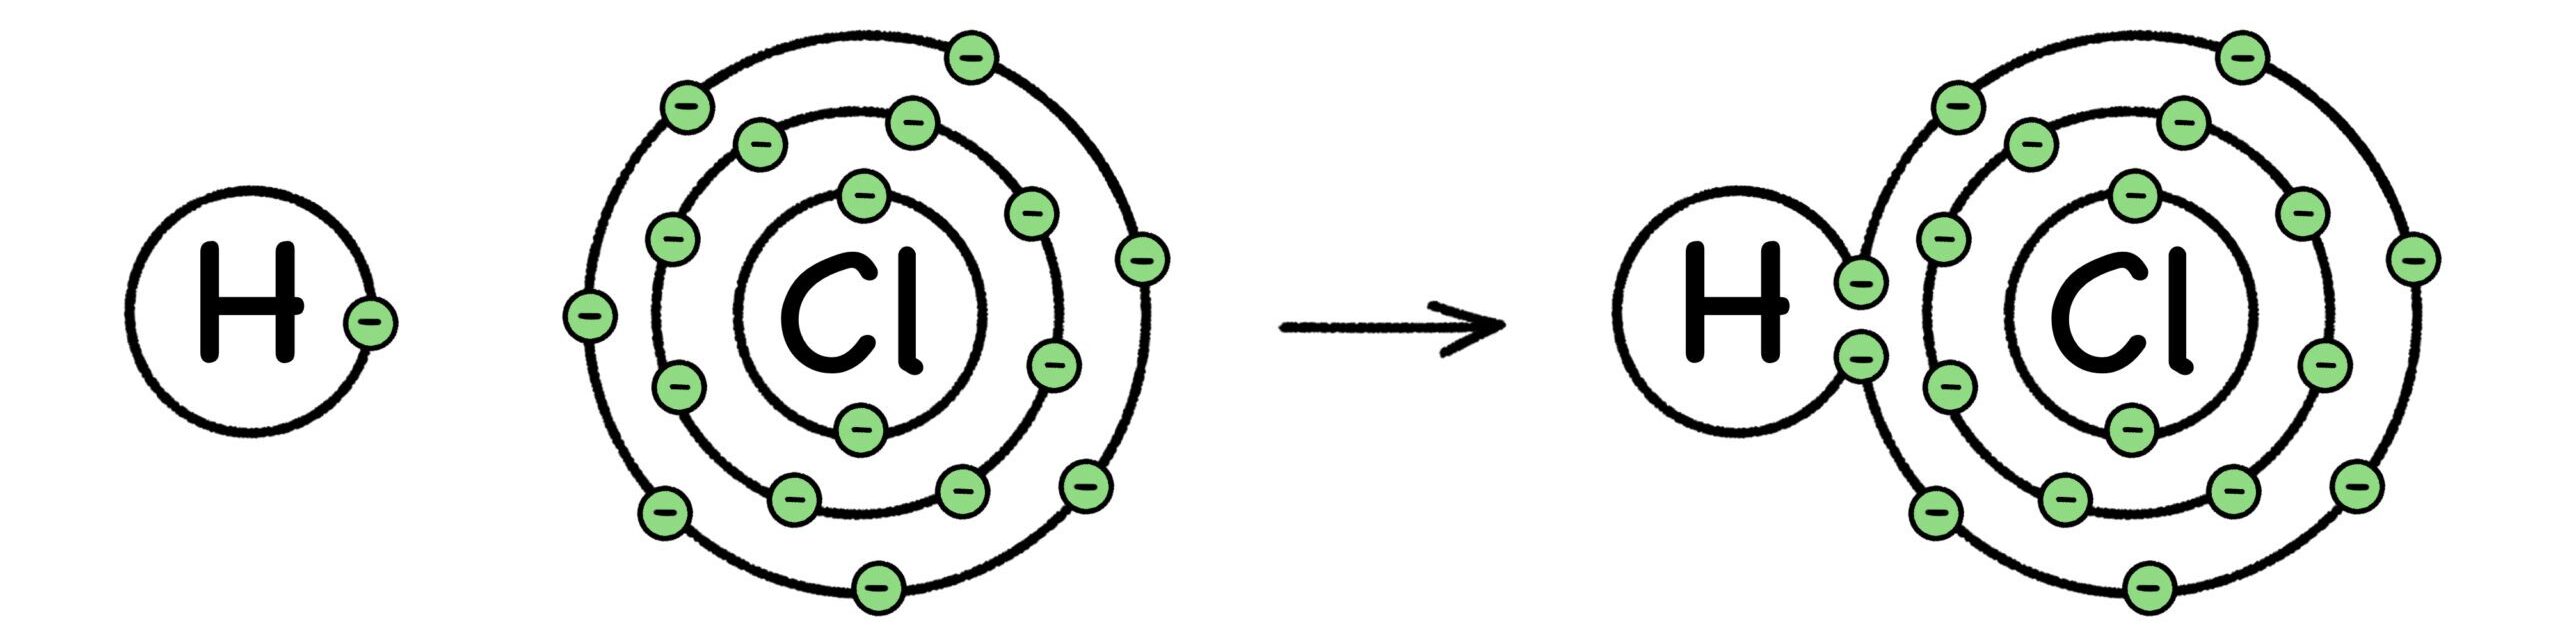
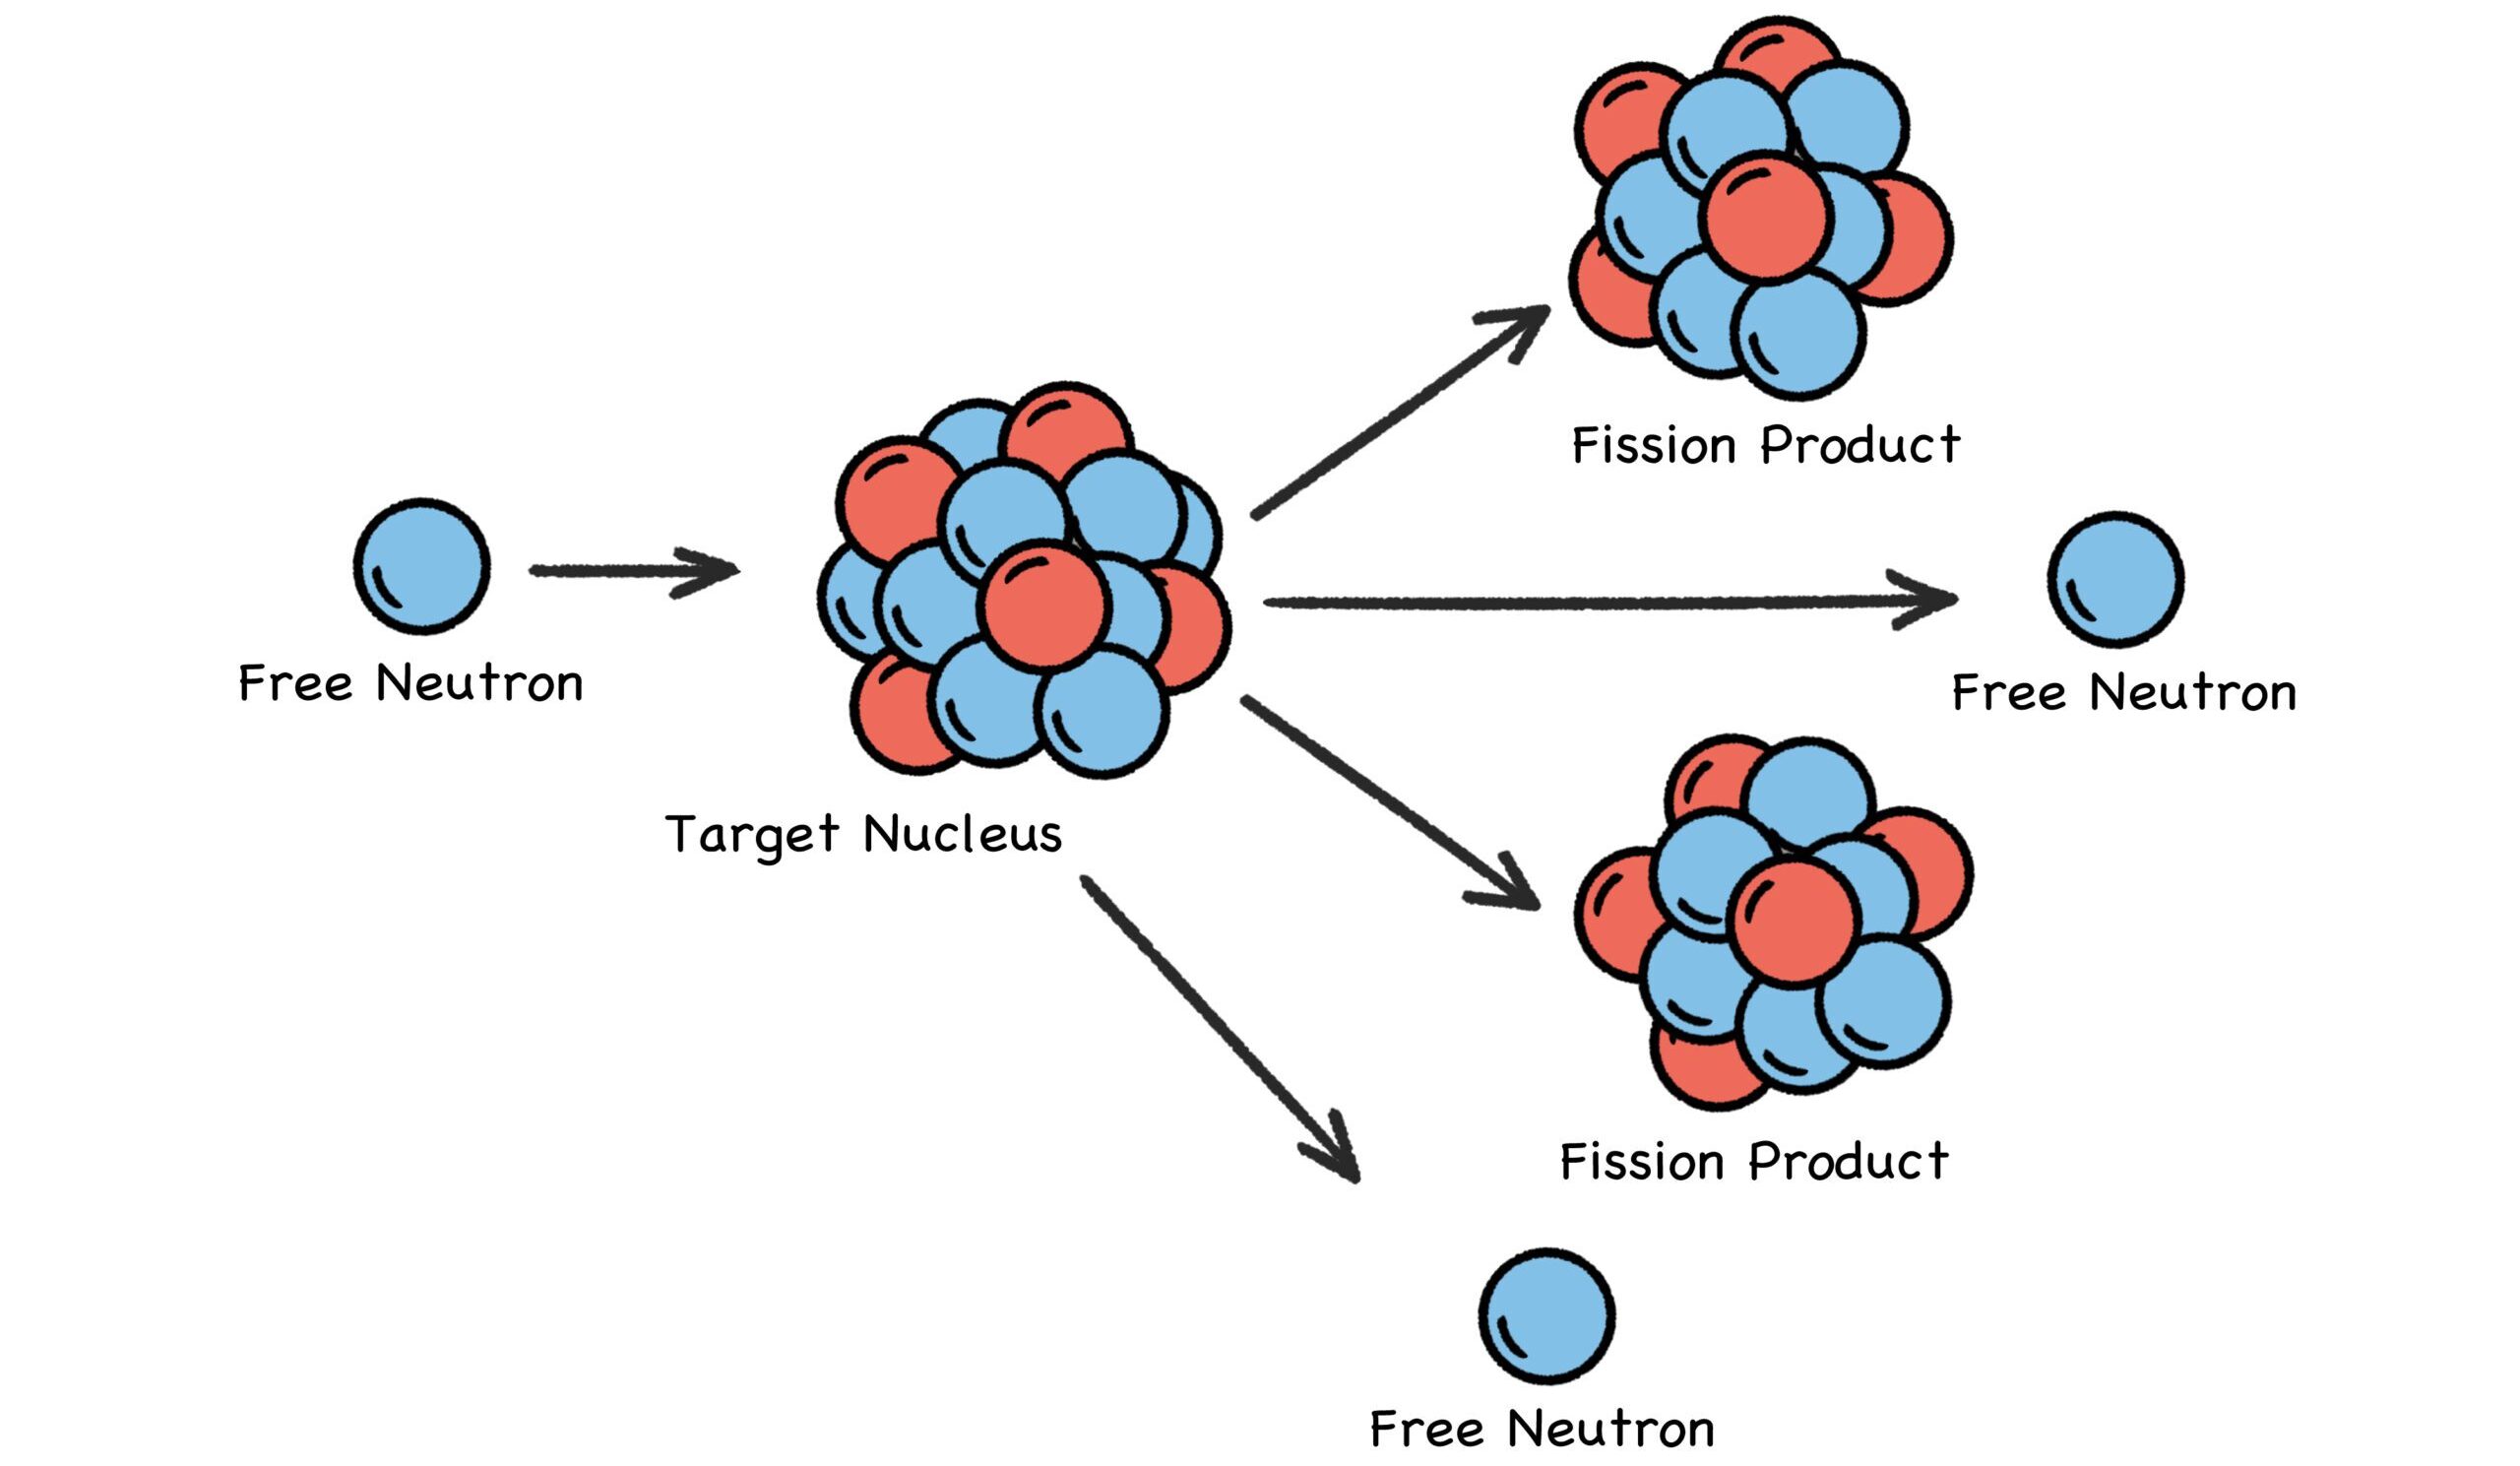
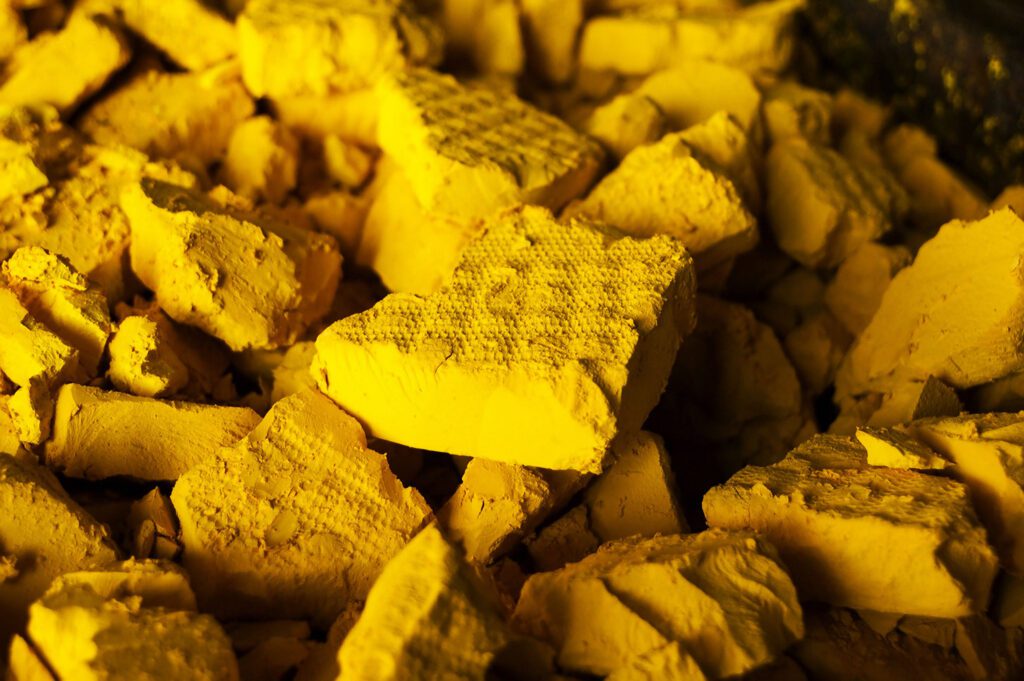
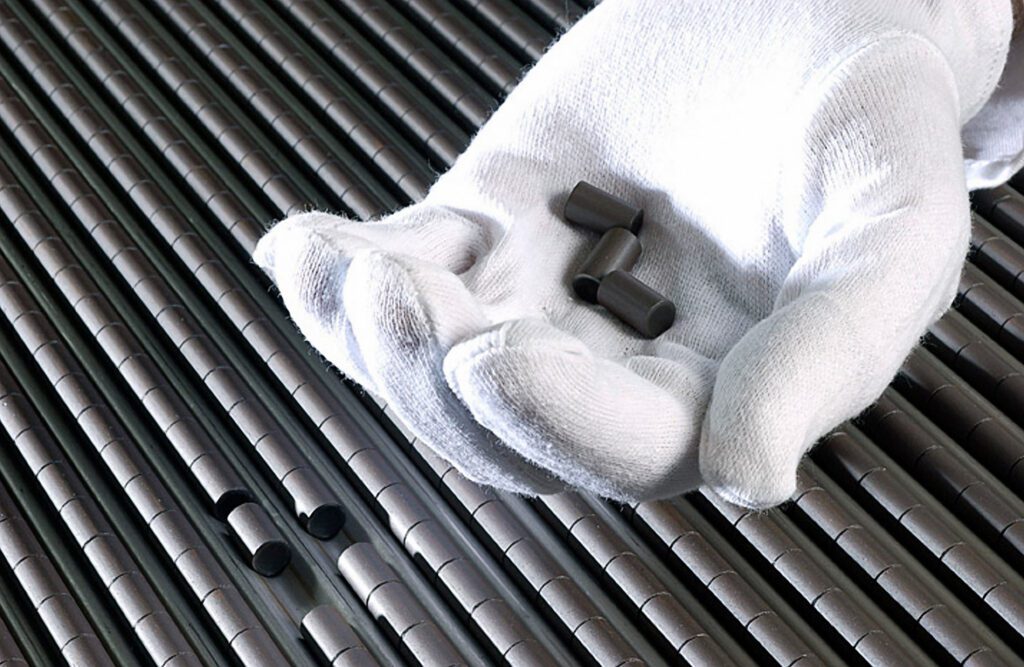
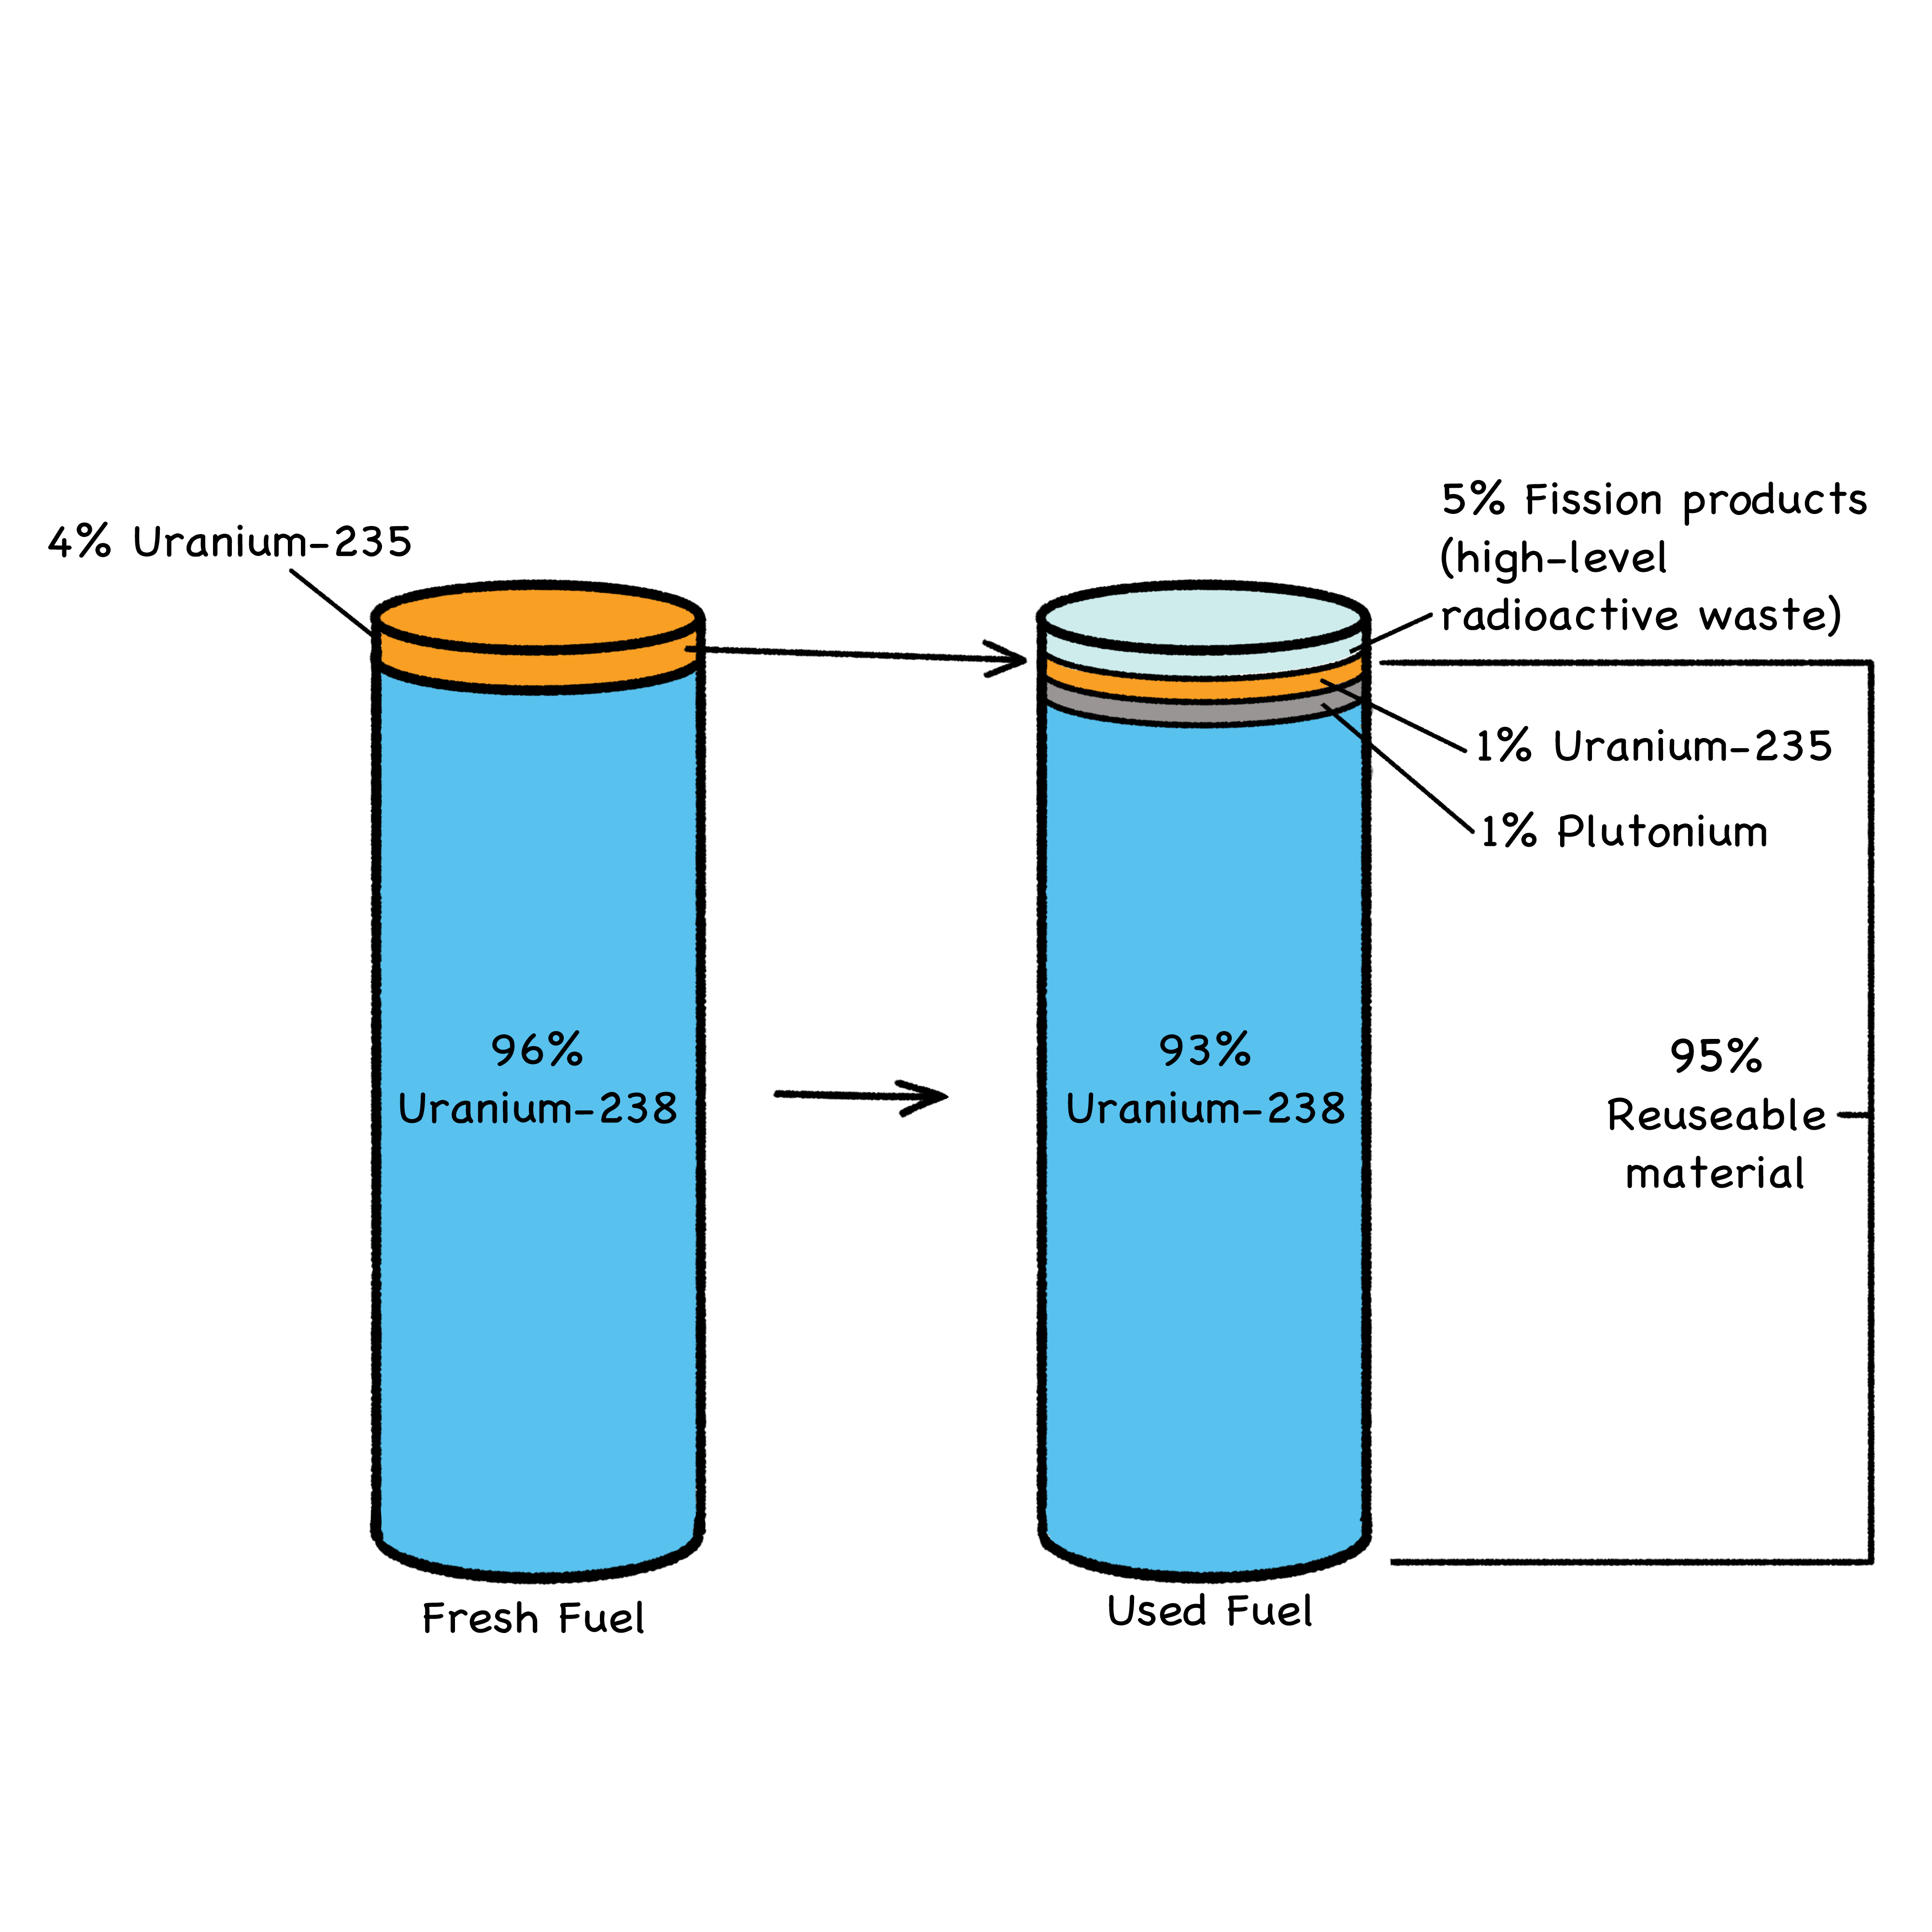
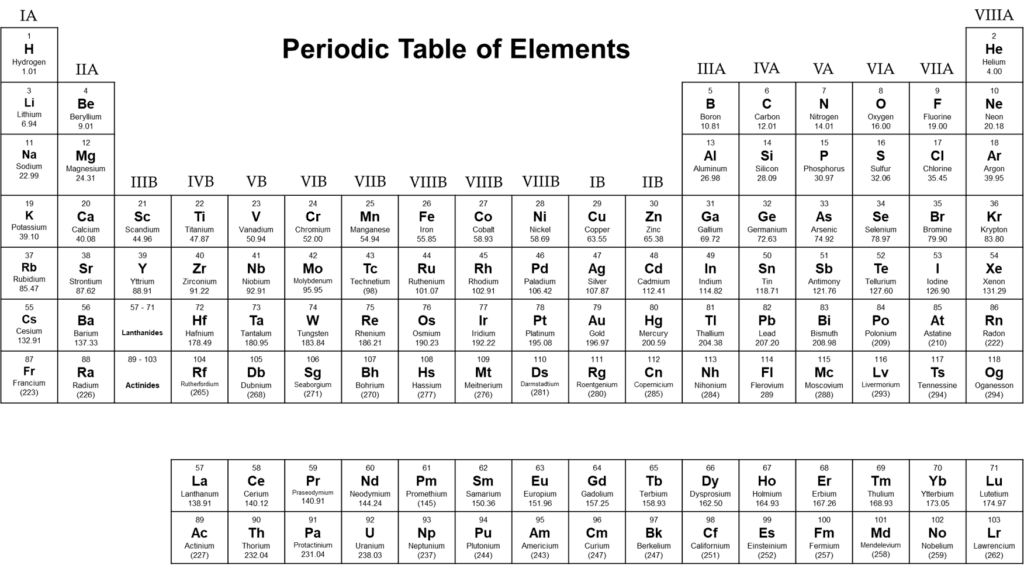
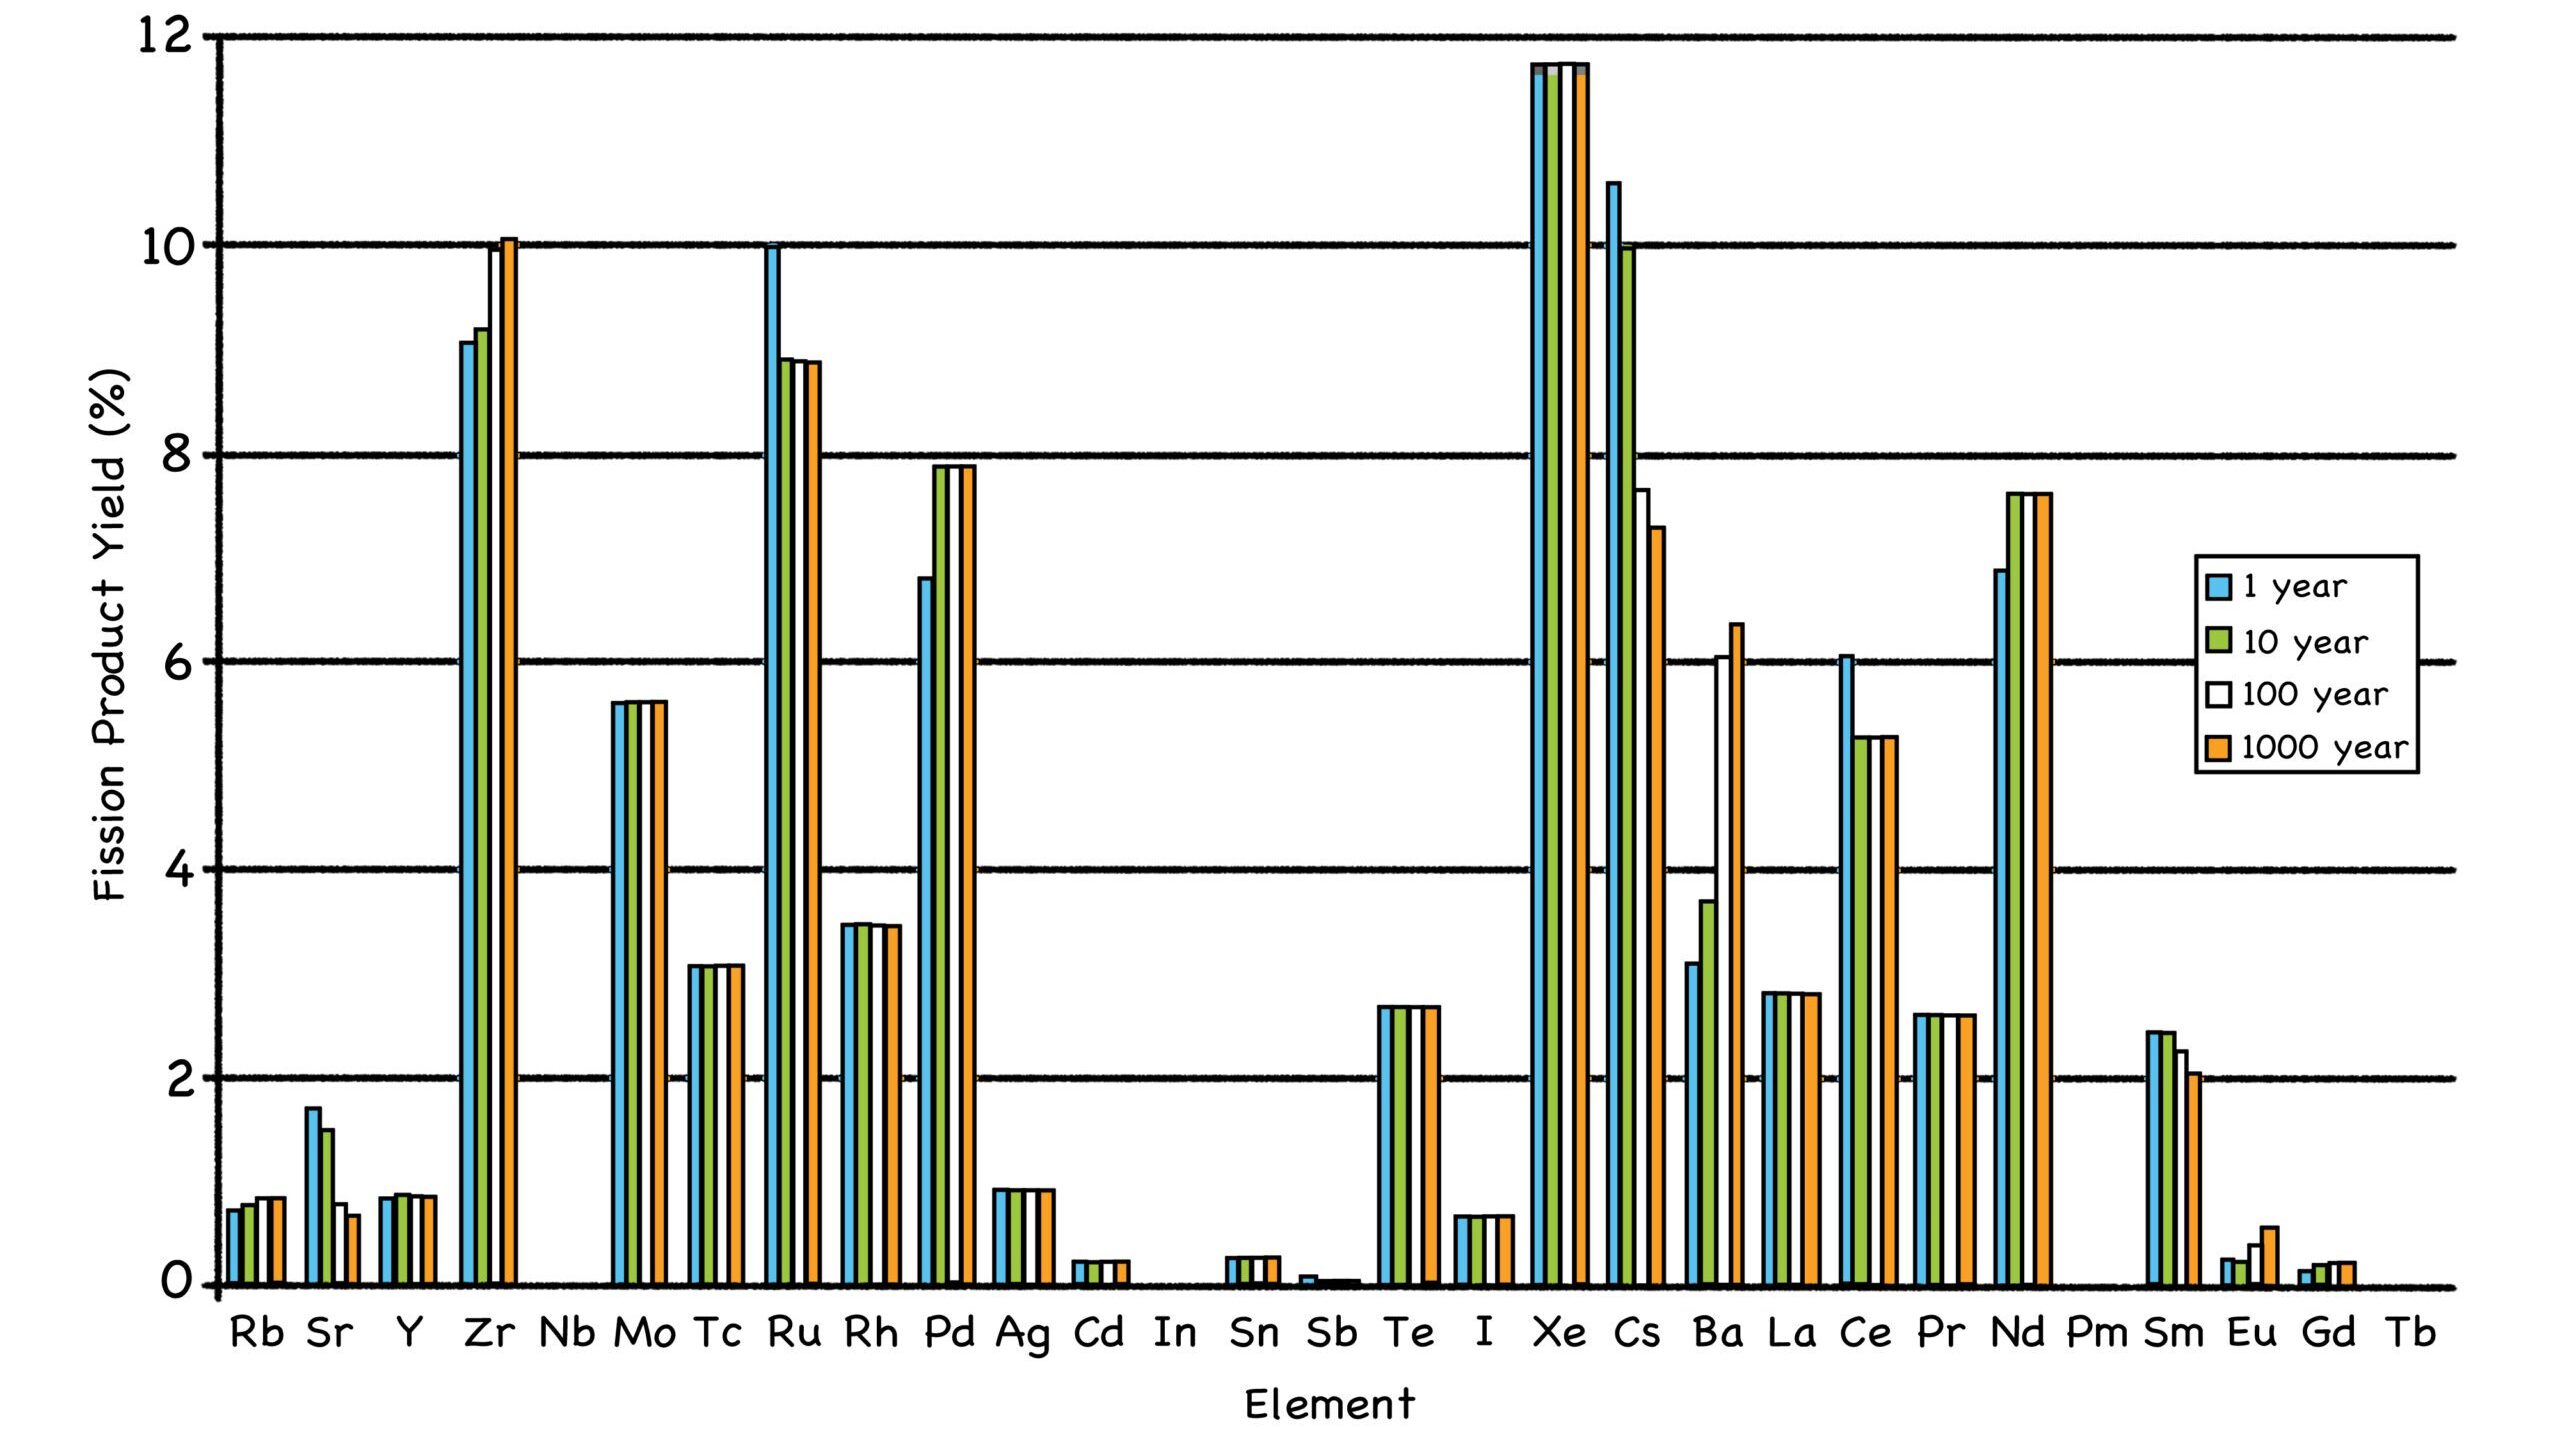
Fig 26: Isotopes of HydrogenFig. 27: Positive Ions (“CAT-eye-ons”)Fig. 28: Negative Ions (“AN-eye-ons”)(Pg. 66) Positive and Negative Ions (We’re sorry you had to see that.)Fig. 29: Formation of Hydrogen ChlorideFig. 30: Nuclear Fission(Pg. 69) Yellowcake Credit: US Nuclear Regulatory Commission (CC-BY-SA-2.0)(Pg. 69) Fuel Pellets Credit: US Nuclear Regulatory Commission (CC-BY-SA-2.0)Fig. 31: Used Fuel MakeupFig. 32: Periodic Table of Elements Credit: Emeka Udenze (CC-BY-SA-4.0)Fig. 33: Distribution of Fission Product Creation Source: https://en.wikipedia.org/wiki/Fission_product_yield# /media/File:Fission_yield_volatile_2.pngFig. 34: Waste Reduction Credit: By the authorsFig. 34: Fuel Processing Credit: By the authors(Pg. 77) Centrifuge Cascade Credit: US Nuclear Regulatory Commission (CC-BY-SA-2.0)Fig. 36: Decay of Used Fuel to Natural Levels Source: Thorium: Energy Cheaper Than Coal (2012) by Robert Hargraves, pg. 206
