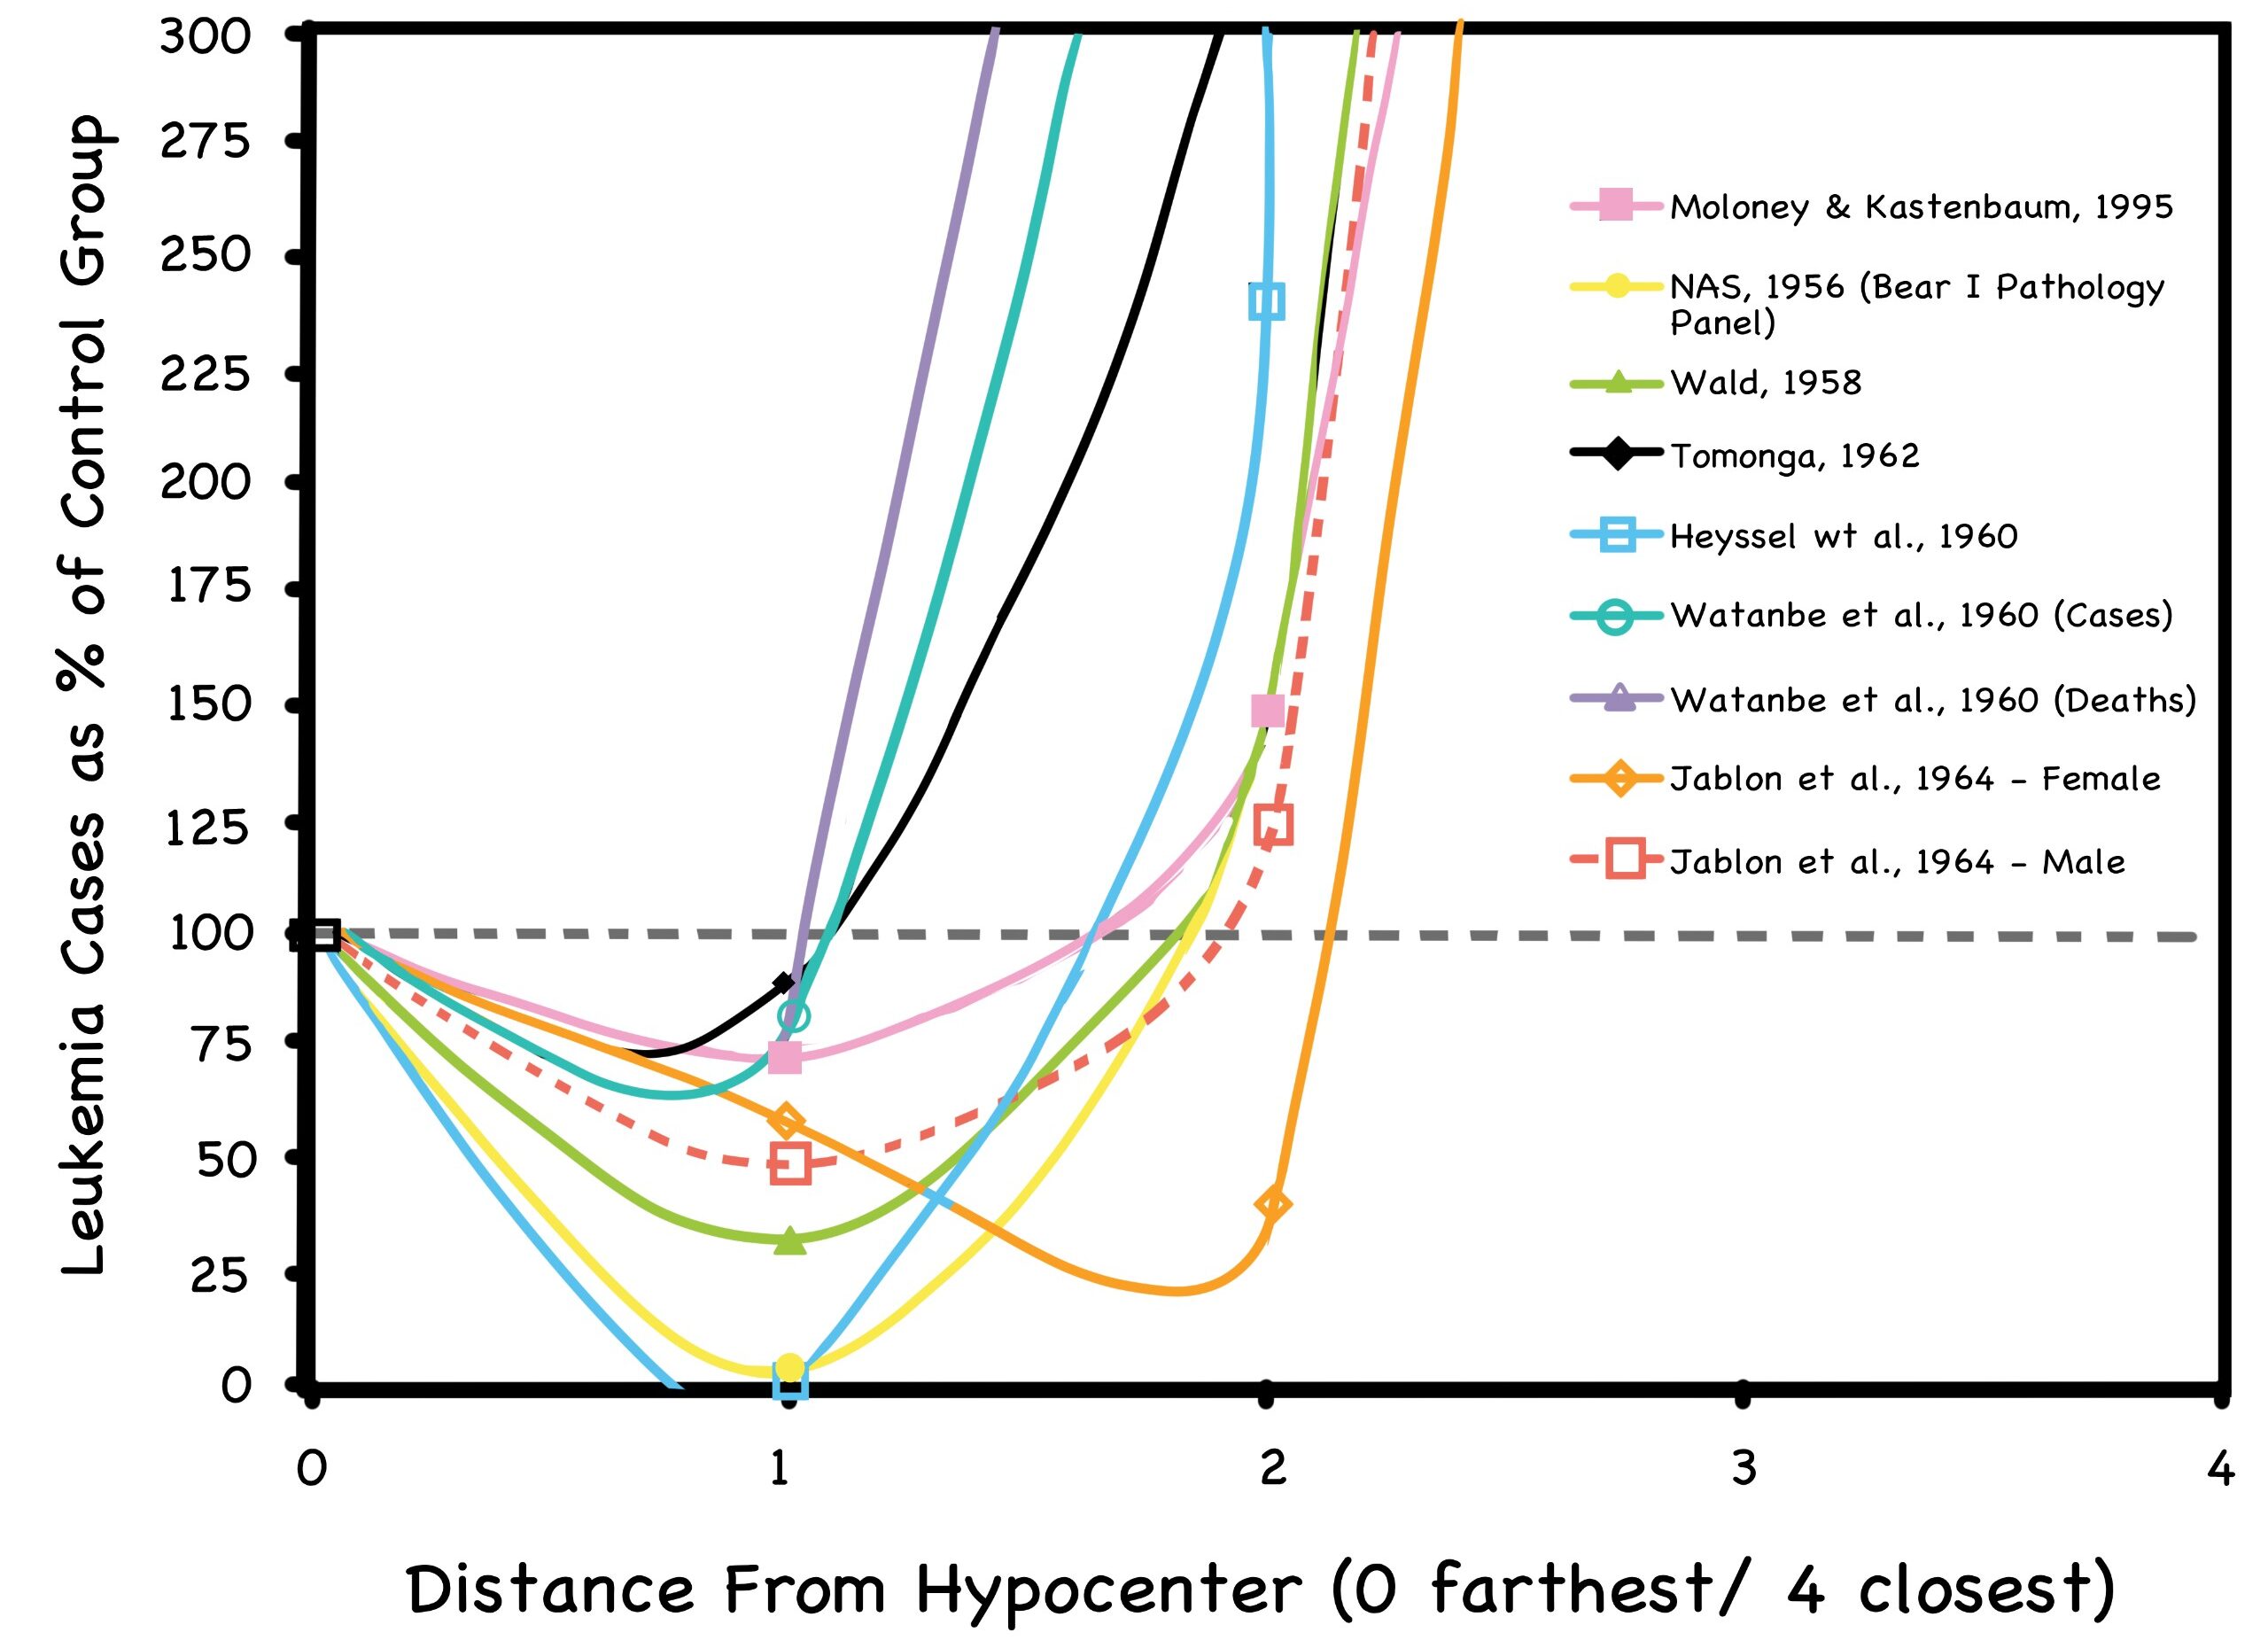
CHAPTER FOURTEEN

(Pg. 181) The J-curve Graph from Chapter Eleven
Fig. 60: Comparison of Yearly Average Doses
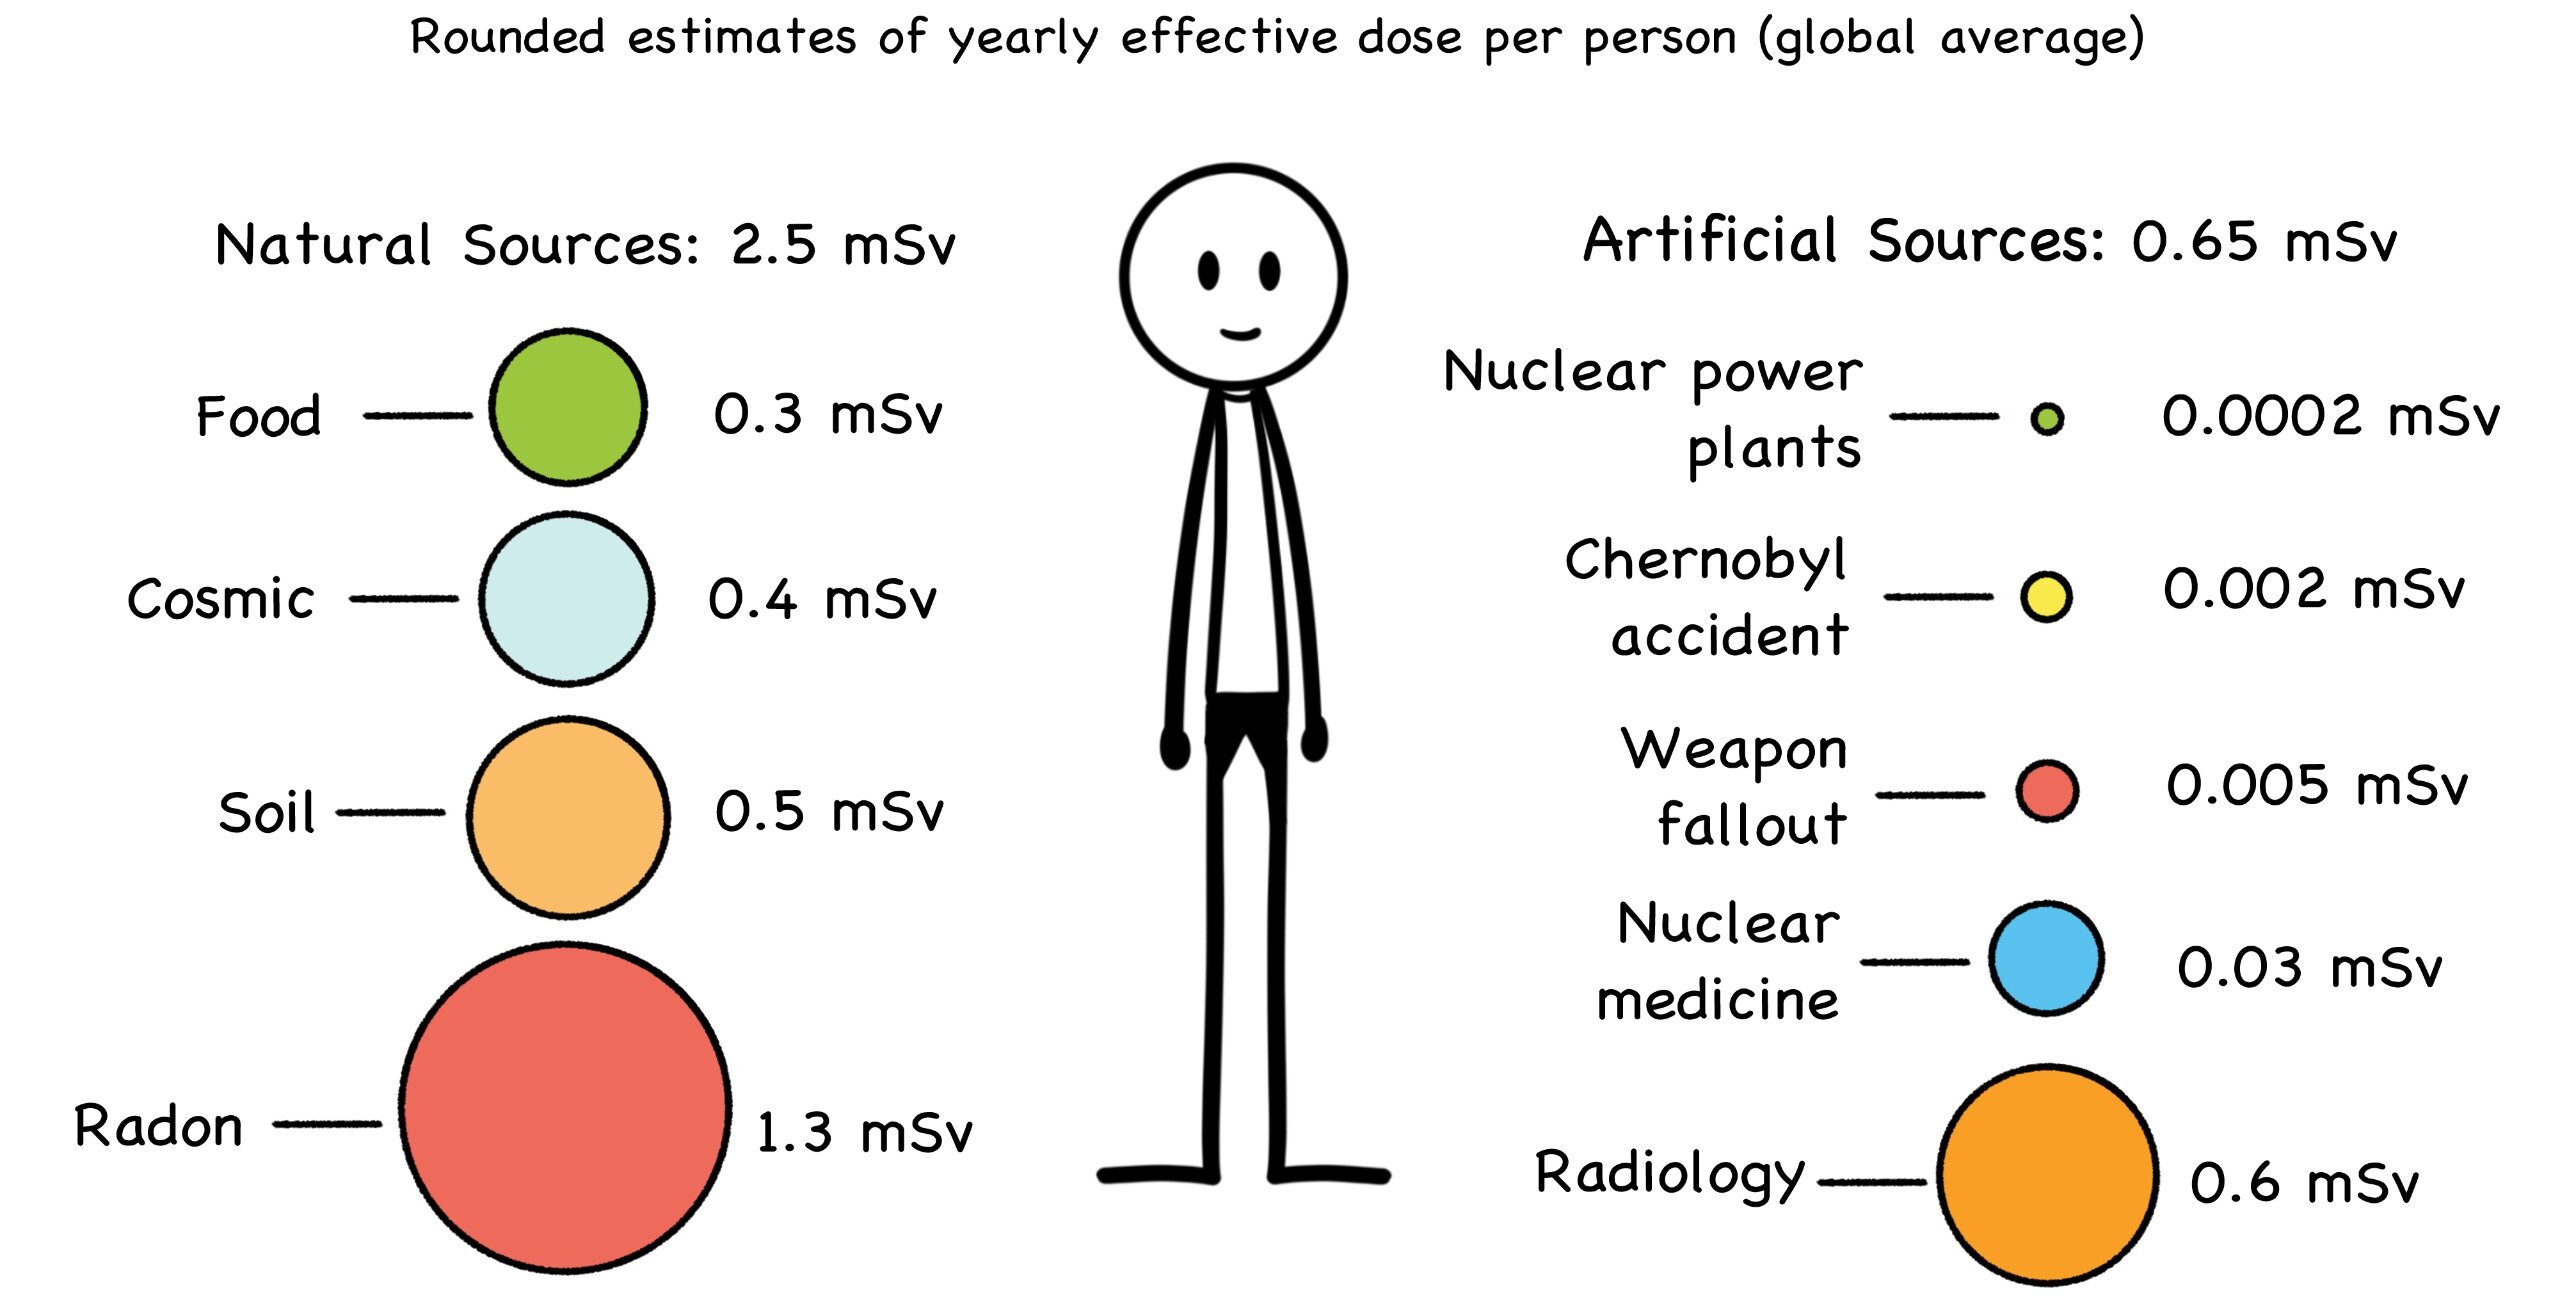
Source: https://www.sageadvisory.com/wp-content/uploads/2019/09/ESG-Perspecitves_October-2019_Nuclear-Power.pdf
(Pg. 190) Fukushima, Japan—Bags of Removed Topsoil
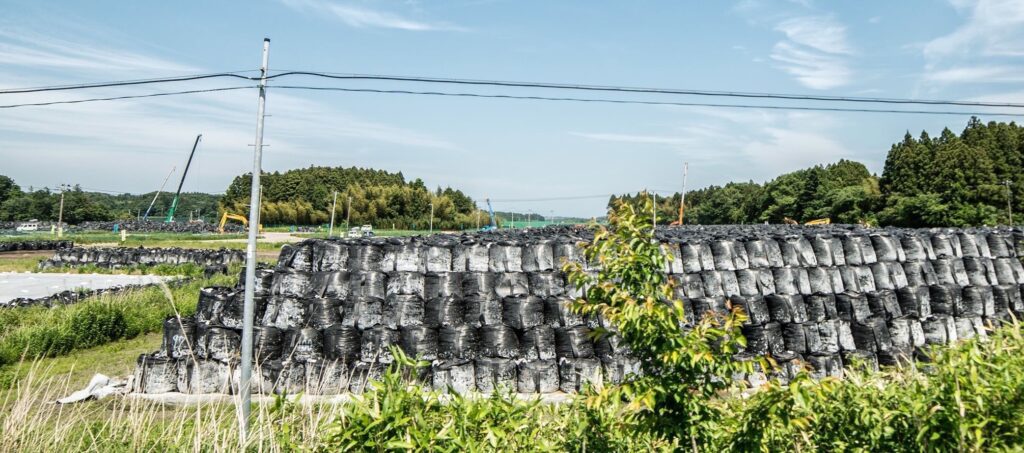
Credit: Keow Wee Loong
(Pg. 192) Fukushima, Japan – Tritiated Water Storage
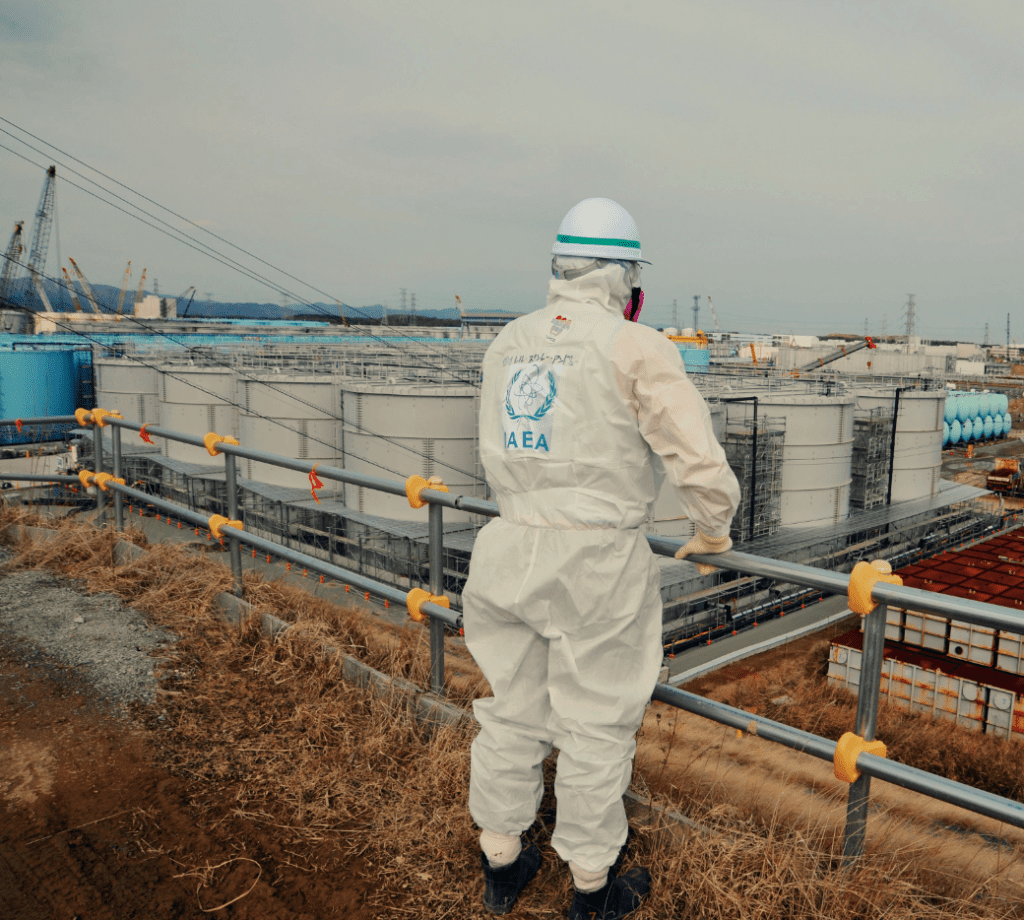
Credit: IAEA Imagebank (CC-BY-SA-2.0)
(Pg. 194) 1978: Jerry Brown Campaigning at UCLA.

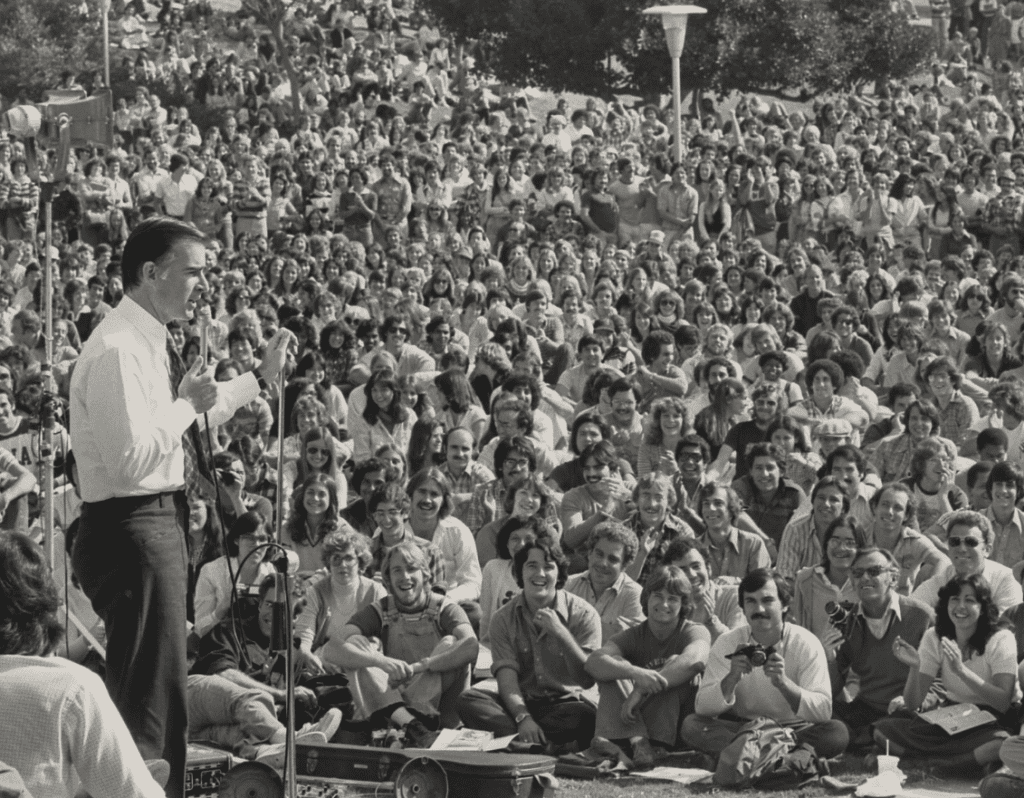
Jerry Brown had the ear of young people, in California and across the nation. One year later as the Governor of California, he spoke at the No Nukes rally near the Diablo Canyon nuclear power plant in the wake of the Three Mile Island incident. Credit: Joe Kennedy, Los Angeles Times (CC-BY-SA-4.0)
(Pg. 198) Inside A Cell (artist’s conception)
Credit: Shutterstock
Scroll to Top