CHAPTER TWENTY-TWO

Fig. 84: New York State Electricity Generation by Source (in terawatt-hours)
Sources: NYISO Power Trends (2020), Gold Book (2020, for rooftop solar), Real-Time Fuel Mix (for 2020), Interconnection Queue (for grid solar & wind, probability adjusted)
(Pg. 299) EROI Graph (reprint from Chapter Three)
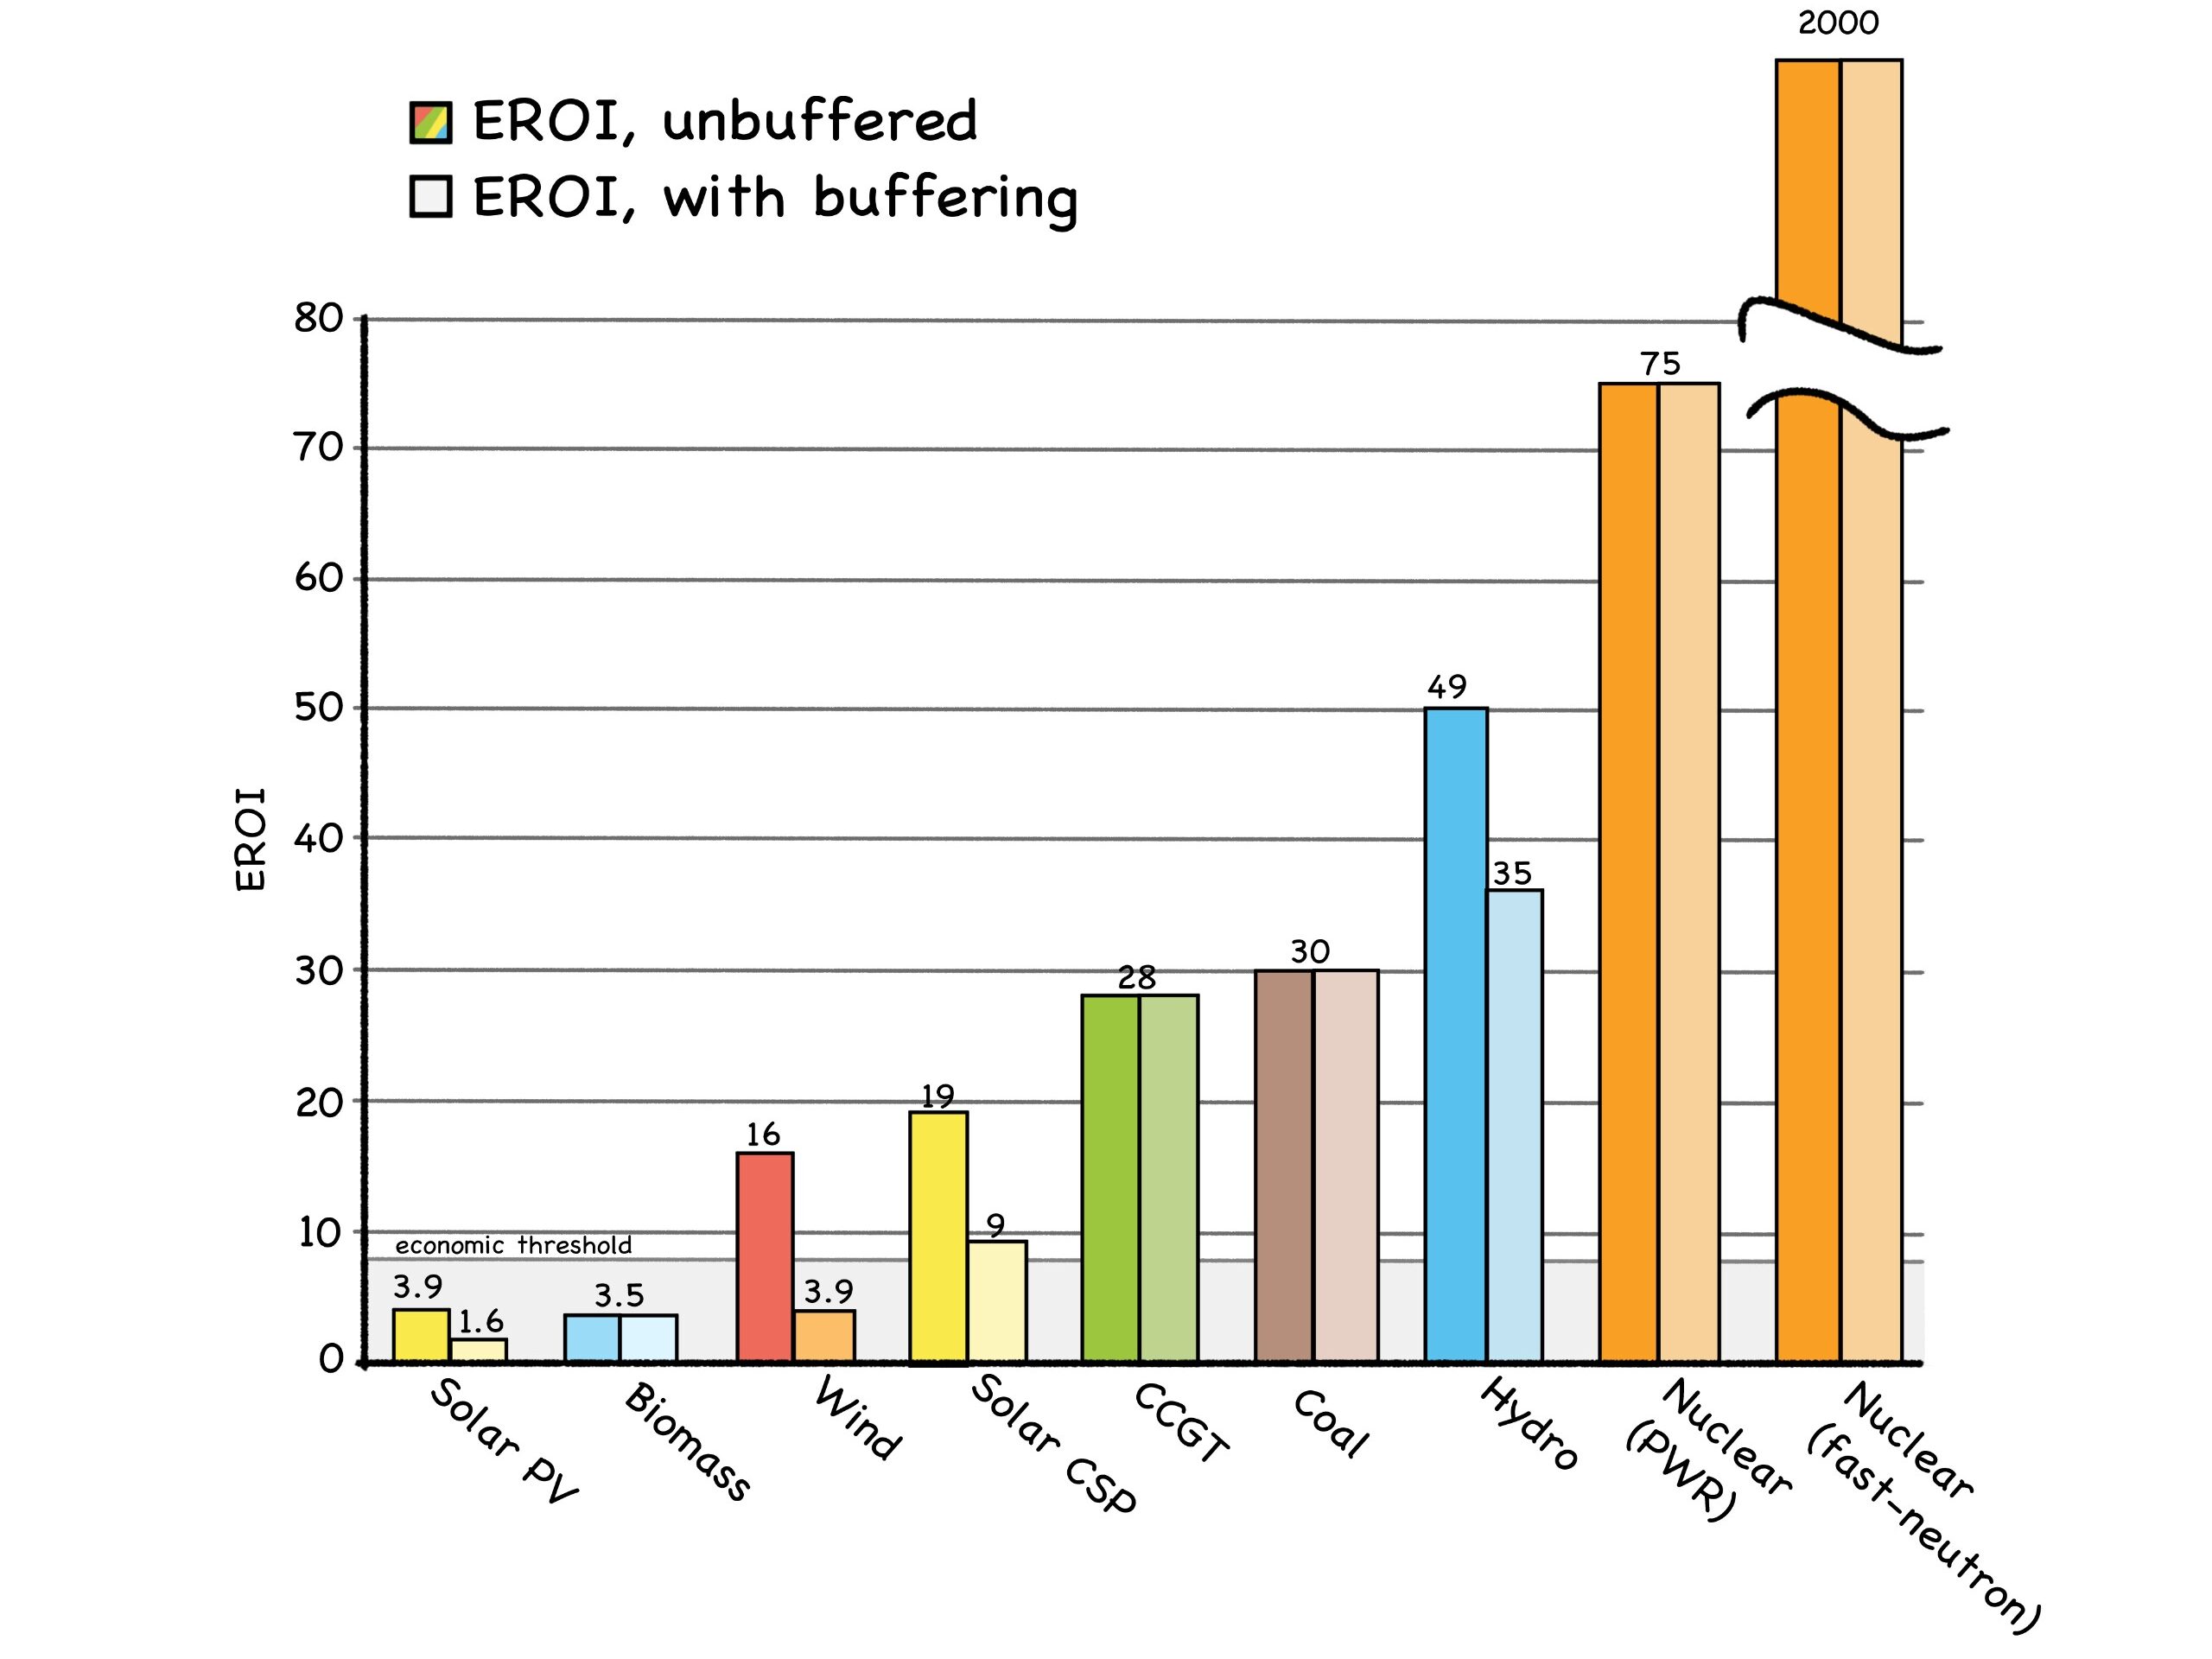
Credit: By the authors
Fig. 85: Global Energy Consumption by Source (1970–2021)
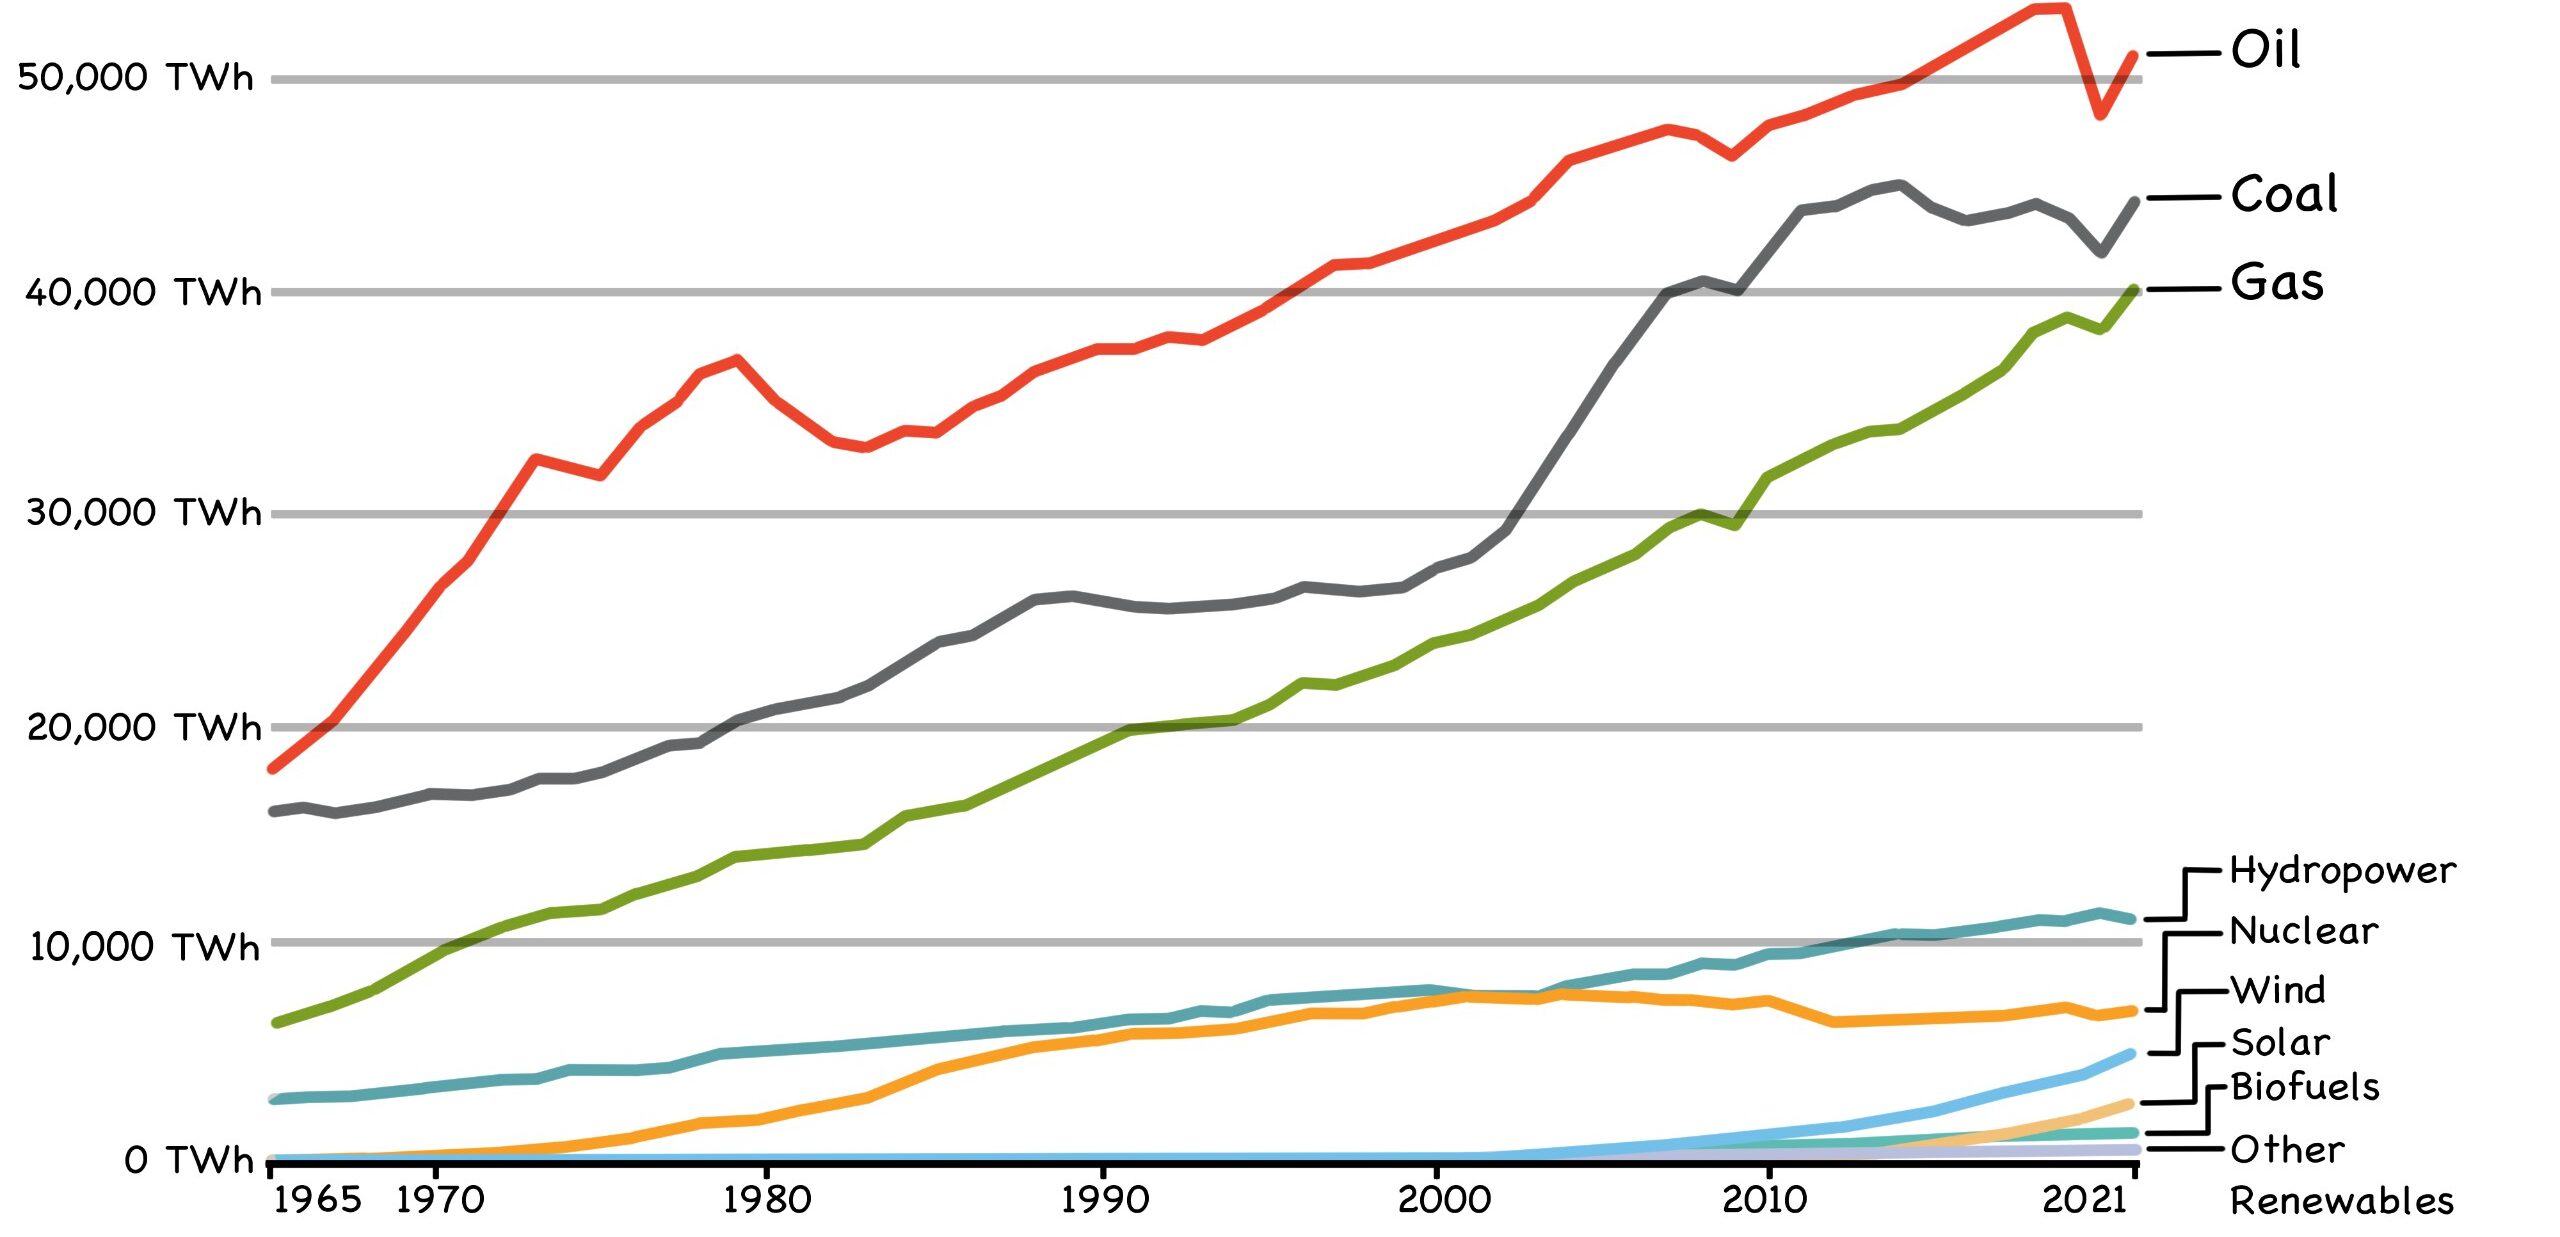
Source: https://ourworldindata.org/grapher/primary-sub-energy-source
Fig. 86: Levelized Cost of Energy by Technology, at 7% Discount Rate
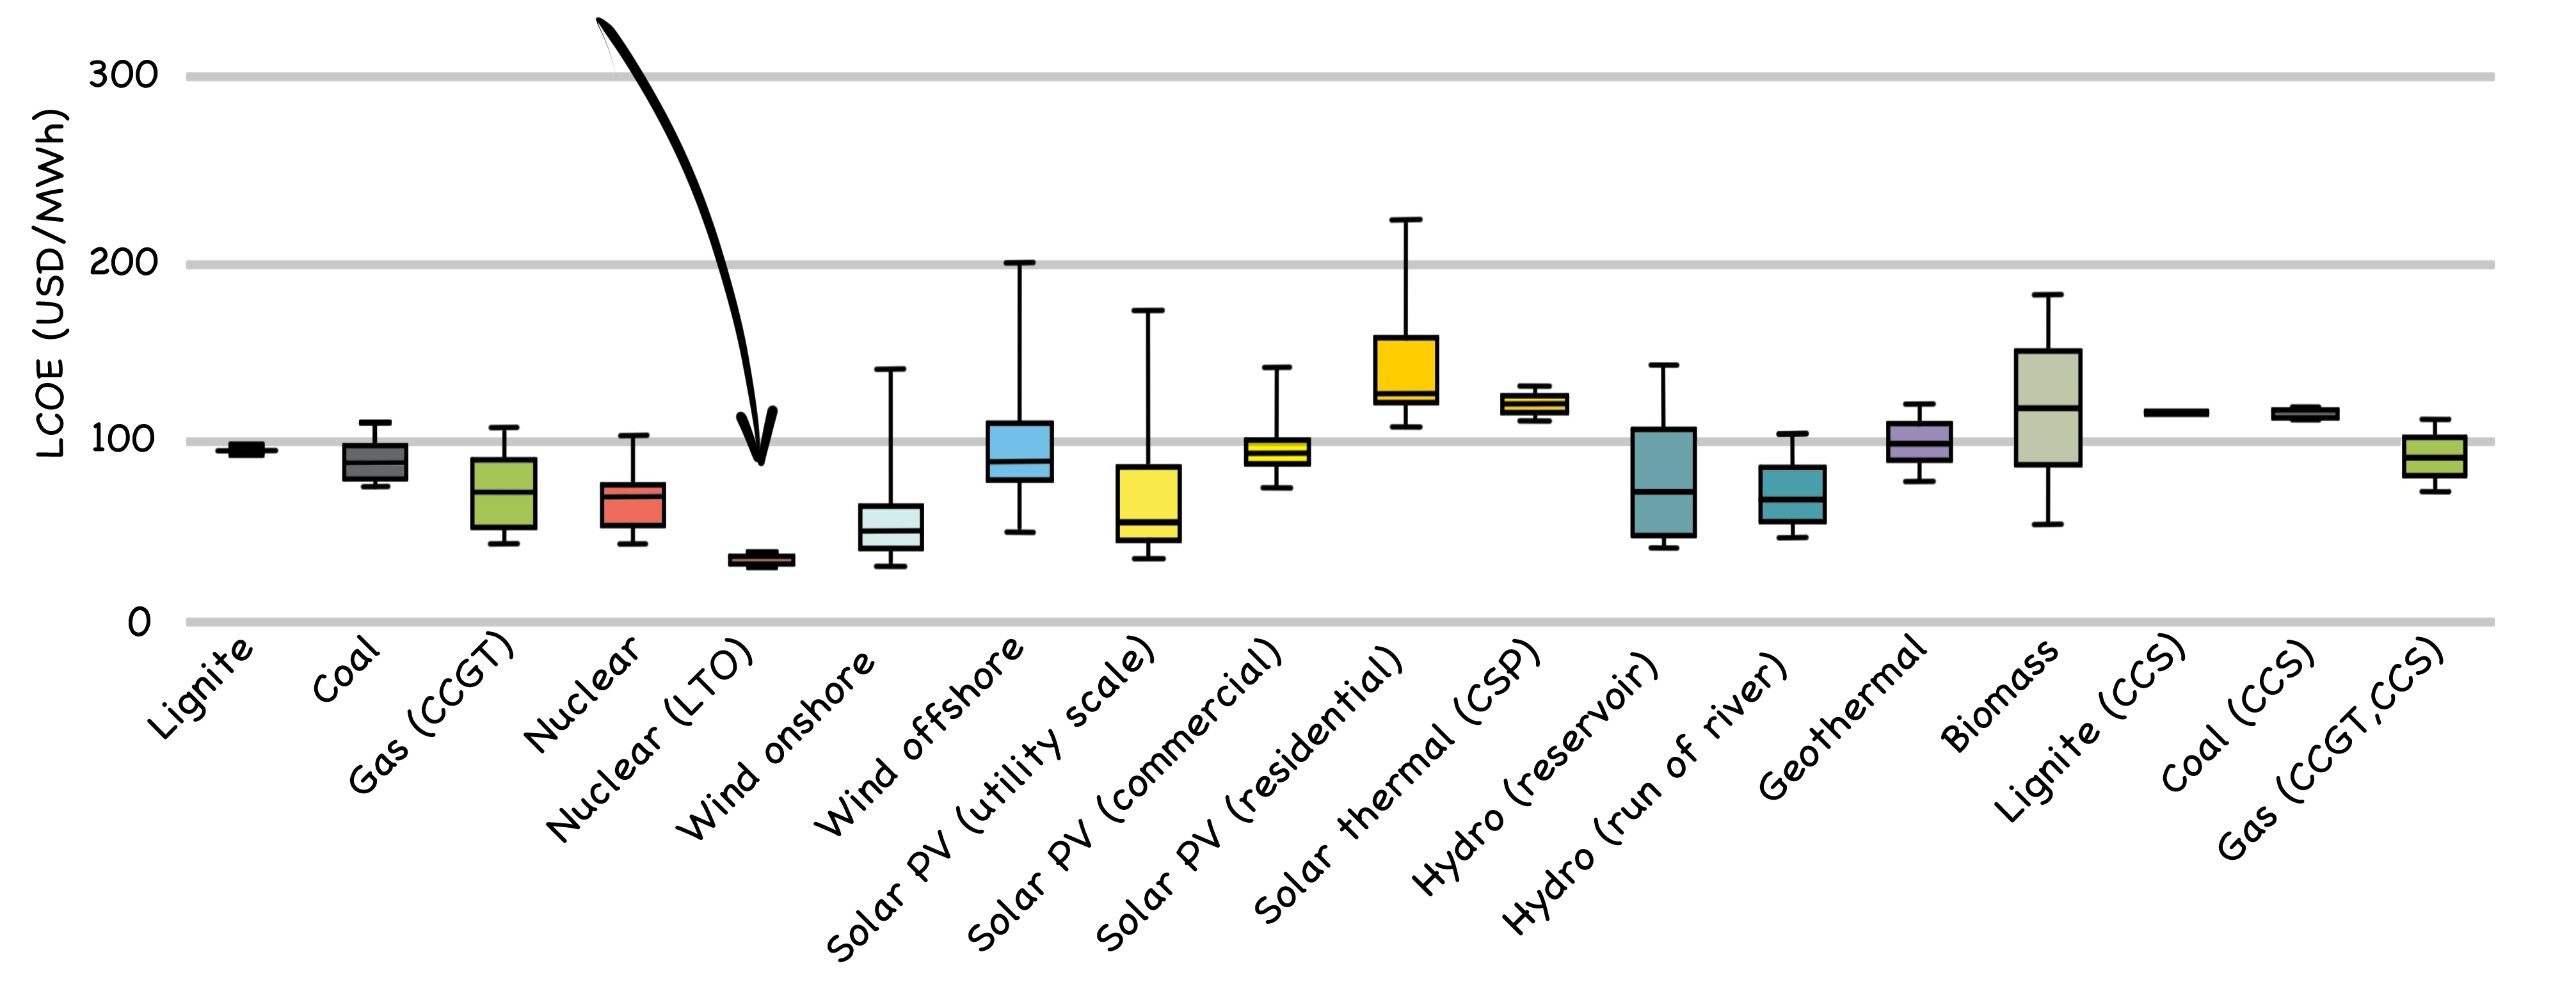
Check out the interactive graph at: https://www.iea.org/reports/projected-costs-of-generating-electricity-2020
Scroll to Top