CHAPTER TWO
Source: https://livinglfs.org/mutants-vs-radiation-trying-to-understand-radiation-in-lfs/
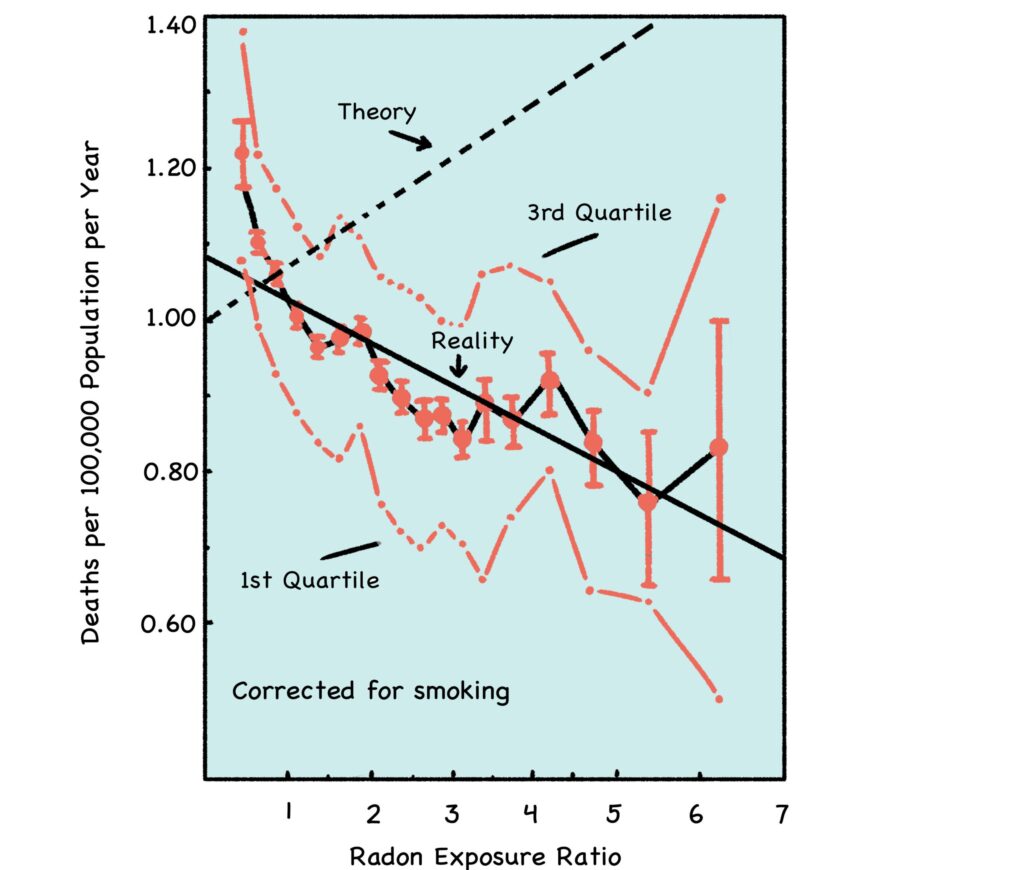
Source: http://www.phyast.pitt.edu/~blc/LNT-1995.PDF
The x-axis shows radon exposure, and the y-axis shows lung cancer mortality. The dashed “Theory” line shows the predicted increase of radon-induced cancer per the LNT model. The solid line shows real-world cancer rates trending lower with increasing levels of radon.

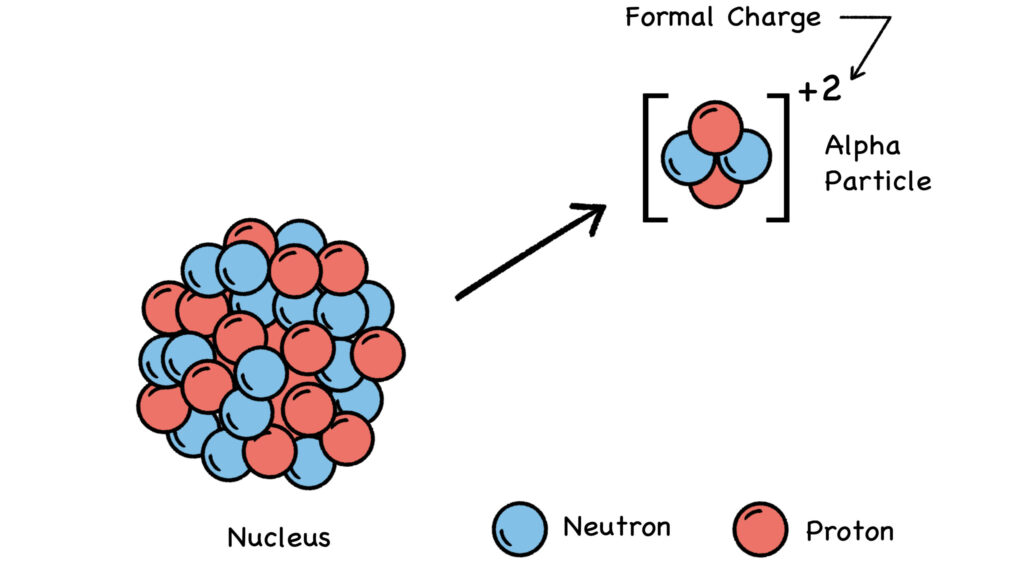
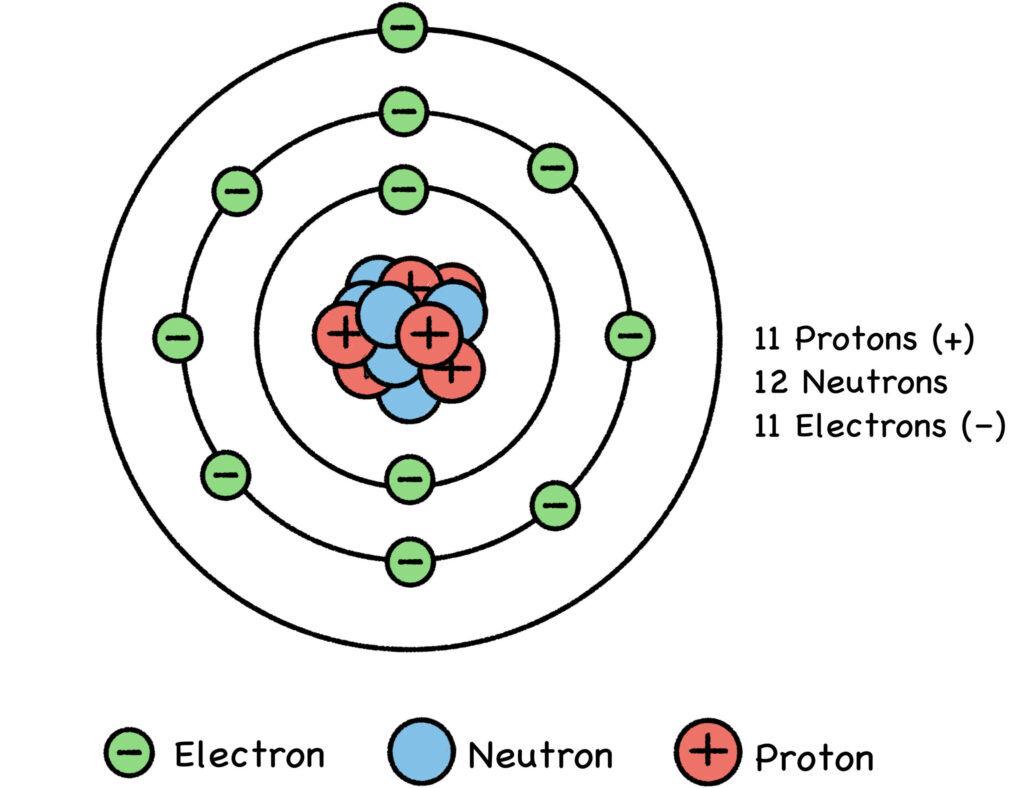
Credit: By Doug Sim. Own work (CC-BY-SA-3.0)
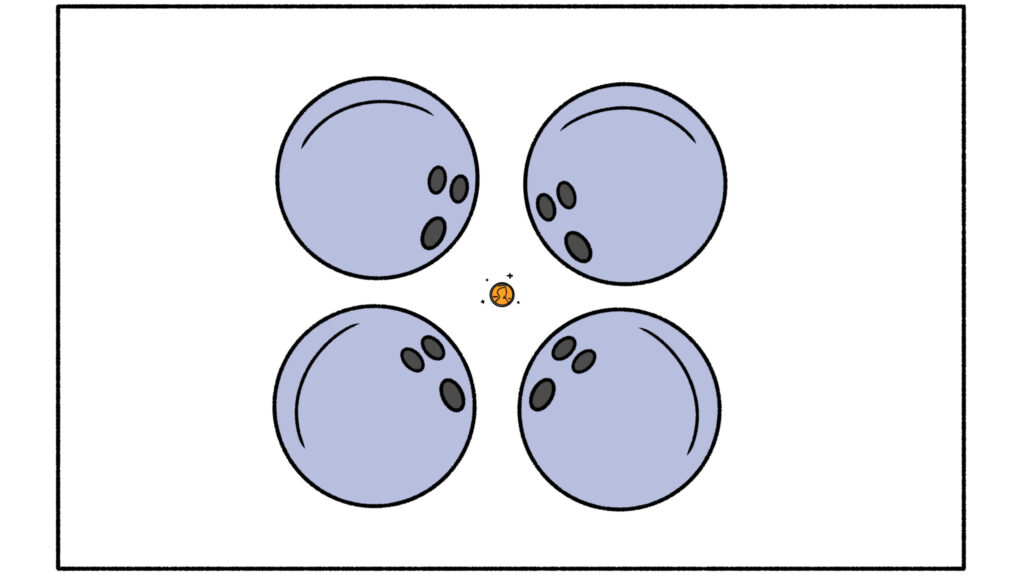
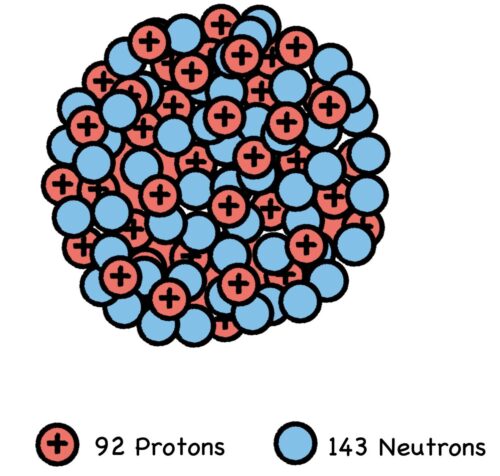
Like a penny vs. four bowling balls

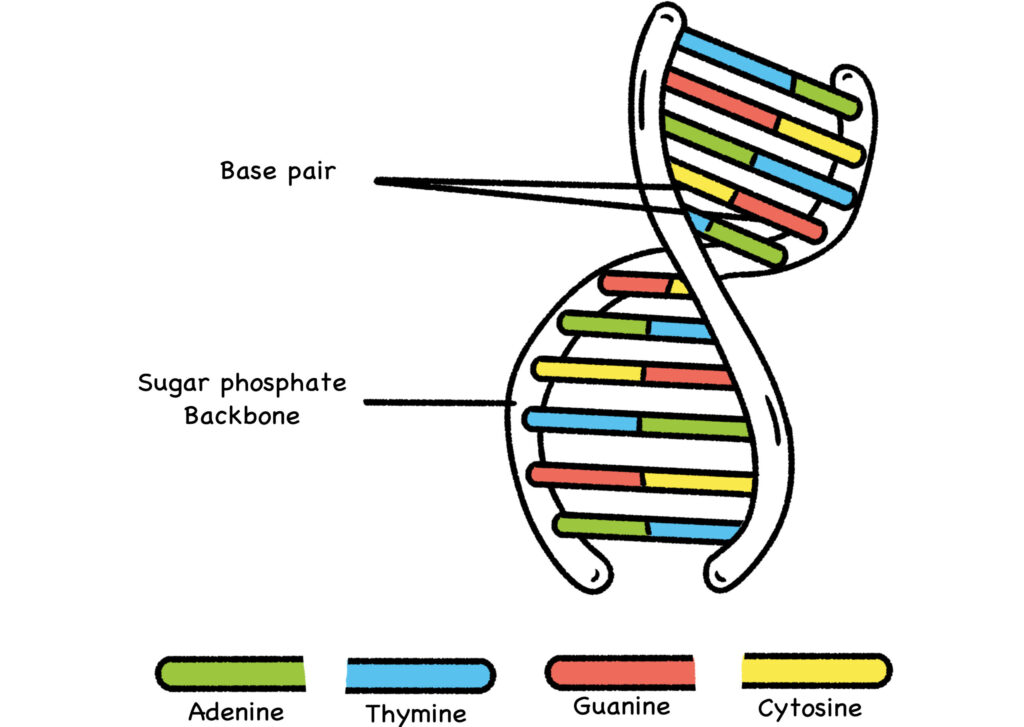
Courtesy of MRC Laboratory of Molecular Biology
(CC-BY-SA-4.0)